Economic Updates
Exchange Rates
The table below shows the current values of exchange rates in the 2025-09 RDLs and the percentage changes in those exchange rates relative to the 2025-06 Regional Data Libraries.
If you use local currencies in your deployment of aPriori, you are advised to update your installation with the exchange rates shown below. To update exchange rates, open the Deployment Data module within the Digital Factory Toolset and edit the values in the Currency tab.
| Currency Name | Currency Symbol | Current Exchange Rate | Percent Change from 2025-06 |
|---|---|---|---|
|
Argentine Peso |
ARS |
0.000742 |
-15.0% |
|
Australian Dollar |
AUD |
0.654260 |
1.6% |
|
Brazilian Real |
BRL |
0.183915 |
4.0% |
|
Canadian Dollar |
CAD |
0.727906 |
0.1% |
|
Chilean Peso |
CLP |
0.001030 |
-3.4% |
|
Chinese Yuan Renminbi |
CNY |
0.140237 |
0.9% |
|
Czech Koruna |
CZK |
0.047893 |
5.1% |
|
Danish Krone |
DKK |
0.156917 |
3.2% |
|
Euro |
EUR |
1.171374 |
3.3% |
|
Hungarian Forint |
HUF |
0.002953 |
5.1% |
|
Indian Rupee |
INR |
0.011330 |
-3.3% |
|
Indonesian Rupiah |
IDR |
0.000061 |
0.0% |
|
Japanese Yen |
JPY |
0.006807 |
-1.7% |
|
Korean Won |
KRW |
0.000718 |
-1.4% |
|
Malaysian Ringgit |
MYR |
0.236686 |
0.3% |
|
Mexican Peso |
MXN |
0.053621 |
3.0% |
|
Morocco Dirham |
MAD |
0.111198 |
2.6% |
|
Norwegian Krone |
NOK |
0.099536 |
1.0% |
|
Philippine Peso |
PHP |
0.017452 |
-3.1% |
|
Polish Zloty |
PLN |
0.274709 |
2.9% |
|
Pound Sterling |
GBP |
1.352439 |
0.0% |
|
Romanian Leu |
RON |
0.230915 |
3.0% |
|
Russian Ruble |
RUB |
0.012447 |
-0.1% |
|
Saudi Arabia Riyal |
SAR |
0.266517 |
0.0% |
|
Shekel (Israel) |
ILS |
0.298954 |
5.7% |
|
Singapore Dollar |
SGD |
0.779174 |
0.4% |
|
South African Rand |
ZAR |
0.056722 |
1.5% |
|
Swedish Krona |
SEK |
0.105811 |
1.8% |
|
Swiss Franc |
CHF |
1.251031 |
3.4% |
|
Taiwan Dollar |
TWD |
0.032649 |
-2.0% |
|
Thai Baht |
THB |
0.030941 |
1.5% |
|
Tunisian Dinar |
TND |
0.343456 |
2.5% |
|
Turkish Lira |
TRY |
0.024306 |
-5.2% |
|
United States Dollar |
USD |
1.000000 |
0.0% |
|
Vietnamese Dong |
VND |
0.000038 |
-2.6% |
Labor Rates
Labor rate differences between the 2025-09 RDLs and the 2025-06 RDLs are primarily due to currency fluctuations in many regions. Because aPriori represents base data in USD, currency exchange rate fluctuations cause labor rates expressed in USD to change, even when they are unchanged when expressed in a region’s native currency.
In addition, updated labor rates were collected for the following regions since the previous RDL release:
China, Czech Republic, Ireland, Italy, Korea, Norway, Switzerland, United Kingdom
Notes:
-
aPriori Western Europe includes data for Ireland and United Kingdom, among other regions, and therefore this RDL also includes updates to Western Europe labor rates.
-
aPriori Eastern Europe includes data for the Czech Republic, among other regions, and therefore this RDL also has updates to Eastern Europe labor rates.
Please use our Labor Rate Data Trends Web page to view labor rate trends over a longer timescale.
The table below shows labor rate changes relative to the 2025-06 Regional Data Libraries release.
|
Region |
Current Avg Labor Rate |
% Change from 2025-06 |
|---|---|---|
|
Argentina |
$8.35 |
0.0% |
|
Australia |
$32.07 |
1.6% |
|
Austria |
$33.34 |
3.3% |
|
Belgium |
$48.08 |
3.3% |
|
Brazil |
$4.11 |
4.0% |
|
Brazil-Sao-Paulo |
$5.32 |
4.0% |
|
Brazil-South |
$4.44 |
4.0% |
|
Brazil-Southeast |
$4.37 |
4.0% |
|
Canada |
$24.39 |
0.1% |
|
Canada-Alberta |
$27.86 |
0.1% |
|
Canada-Atlantic (PE-NB-NL-NS) |
$21.11 |
0.1% |
|
Canada-Ontario |
$24.27 |
0.1% |
|
Canada-Quebec |
$22.29 |
0.1% |
|
Canada-West (BC-MB-SK) |
$23.26 |
0.1% |
|
Chile |
$6.07 |
-3.4% |
|
China |
$11.06 |
-14.6% |
|
China-Central-Hubei-Wuhan |
$9.26 |
-14.6% |
|
China-East-Jiangsu-Suzhou |
$11.35 |
-14.6% |
|
China-East-Shandong-Qingdao |
$9.58 |
-14.6% |
|
China-East-Shanghai |
$14.25 |
-14.6% |
|
China-East-Zhejiang-Hangzhou |
$11.75 |
-14.6% |
|
China-North-Beijing |
$19.76 |
-14.6% |
|
China-North-Hebei-Tianjin |
$8.64 |
-14.6% |
|
China-Northeast-Liaoning-Dalian |
$8.52 |
-14.6% |
|
China-SouthCentral-Guangdong-Guangzhou |
$11.39 |
-14.6% |
|
China-Southwest-Chongqing |
$8.83 |
-14.6% |
|
China-Southwest-Sichuan-Chengdu |
$9.70 |
-14.6% |
|
Czech Republic |
$18.69 |
8.6% |
|
Denmark |
$51.92 |
3.2% |
|
Eastern Europe |
$16.97 |
5.0% |
|
Finland |
$34.12 |
3.3% |
|
France |
$43.88 |
3.3% |
|
Germany |
$39.07 |
3.3% |
|
Hungary |
$14.31 |
5.1% |
|
India |
$2.11 |
-3.3% |
|
India-Delhi |
$2.33 |
-3.3% |
|
India-Karnataka |
$2.71 |
-3.3% |
|
India-Maharashtra |
$2.57 |
-3.3% |
|
India-West Bengal |
$2.46 |
-3.3% |
|
Indonesia |
$1.21 |
0.0% |
|
Ireland |
$40.60 |
11.0% |
|
Israel |
$21.82 |
5.7% |
|
Italy |
$25.88 |
5.5% |
|
Japan |
$14.67 |
-1.7% |
|
Malaysia |
$4.59 |
0.3% |
|
Mexico |
$6.46 |
3.0% |
|
Mexico-Mexico City |
$8.77 |
3.0% |
|
Mexico-North |
$7.01 |
3.0% |
|
Mexico-South-West |
$5.11 |
3.0% |
|
Morocco |
$11.57 |
2.6% |
|
Netherlands |
$38.52 |
3.3% |
|
Norway |
$44.97 |
6.8% |
|
Philippines |
$2.08 |
-3.1% |
|
Poland |
$18.56 |
2.9% |
|
Portugal |
$14.98 |
3.3% |
|
Romania |
$13.93 |
3.0% |
|
Russia |
$6.77 |
-0.1% |
|
Russia-Altaiski Krai |
$4.22 |
-0.1% |
|
Russia-City of Moscow |
$12.32 |
-0.1% |
|
Russia-Kaluga |
$6.18 |
-0.1% |
|
Russia-Leningrad |
$7.13 |
-0.1% |
|
Russia-Moscow region |
$8.54 |
-0.1% |
|
Russia-Republic of Dagestan |
$3.71 |
-0.1% |
|
Russia-Saint Petersburg |
$9.70 |
-0.1% |
|
Russia-Sverdlovsk |
$7.15 |
-0.1% |
|
Russia-Tyumen |
$16.89 |
-0.1% |
|
Russia-Udmurtia |
$4.90 |
-0.1% |
|
Saudi Arabia |
$12.03 |
0.0% |
|
Singapore |
$30.32 |
0.4% |
|
Slovakia |
$16.30 |
3.3% |
|
South Africa |
$7.16 |
1.5% |
|
South Korea |
$22.98 |
5.9% |
|
Spain |
$19.76 |
3.3% |
|
Sweden |
$29.98 |
1.8% |
|
Switzerland |
$67.72 |
11.5% |
|
Taiwan |
$10.16 |
-2.0% |
|
Thailand |
$2.37 |
1.5% |
|
Tunisia |
$1.66 |
2.5% |
|
Turkey |
$3.97 |
-5.2% |
|
USA |
$39.72 |
0.0% |
|
USA-California |
$46.14 |
0.0% |
|
USA-Central (AR-IA-KS-MT-NE-ND-OK-SD) |
$31.50 |
0.0% |
|
USA-Mid-Atlantic (DE-MD-PA-VA) |
$41.54 |
0.0% |
|
USA-Mountain (AZ-CO-ID-NV-NM-UT-WY) |
$35.19 |
0.0% |
|
USA-North Central (IL-MI-MN-OH-WI) |
$38.02 |
0.0% |
|
USA-Northeast (MA-NY-NJ-CT) |
$49.32 |
0.0% |
|
USA-Northeast-Rural (ME-NH-RI-VT) |
$35.80 |
0.0% |
|
USA-Pacific (WA-OR-HI-AK) |
$37.62 |
0.0% |
|
USA-Southeast (AL-FL-GA-IN-KY-LA-MO-MS-NC-SC-TN-WV) |
$33.72 |
0.0% |
|
USA-Texas |
$39.96 |
0.0% |
|
United Kingdom |
$29.14 |
1.9% |
|
Vietnam |
$1.87 |
-2.6% |
|
Western Europe |
$35.20 |
4.5% |
Note: The labor rate column shows the average labor rate per country across all skill levels.
Labor Rate Calculation
Labor Rates are calculated using the following equation:
Fully Burdened Labor Rate = Direct Wage * (1 + Direct Benefits Factor + Social Insurance Factor)
-
Direct Wage: provided by an external consulting group.
-
Direct Benefits Factor: accounts for Paid time off, Bonuses, Retirement fund contributions etc. for the region. This factor is determined using a variety of sources and aPriori research.
-
Social Insurance Factor: accounts for Health insurance, Disability insurance, Taxes, etc. for the region. Again this factor is determined using the above resources.
Total Manufacturing Rates
This table shows changes in total manufacturing rates (labor + direct overhead + indirect overhead) relative to the 2025-06 Regional Data Libraries release. All columns with rates included are the average rate for that specified country.
| Region | Current Avg Labor Rate | Direct Overhead Rate | Indirect Overhead Rate | Total Manufacturing Rate | Percent Change from 2025-06 |
|---|---|---|---|---|---|
|
Argentina |
$8.35 |
$82.21 |
$5.18 |
$95.73 |
0.0% |
|
Australia |
$32.07 |
$51.49 |
$16.03 |
$99.59 |
1.4% |
|
Austria |
$33.34 |
$56.95 |
$16.47 |
$106.76 |
2.4% |
|
Belgium |
$48.08 |
$44.15 |
$22.10 |
$114.33 |
2.5% |
|
Brazil |
$4.11 |
$44.01 |
$3.20 |
$51.32 |
0.7% |
|
Brazil-Sao-Paulo |
$5.32 |
$44.01 |
$4.14 |
$53.47 |
0.8% |
|
Brazil-South |
$4.44 |
$44.01 |
$3.44 |
$51.89 |
0.7% |
|
Brazil-Southeast |
$4.37 |
$44.01 |
$3.39 |
$51.77 |
0.7% |
|
Canada |
$24.39 |
$41.05 |
$12.37 |
$77.80 |
1.2% |
|
Canada-Alberta |
$27.86 |
$41.05 |
$14.12 |
$83.03 |
1.1% |
|
Canada-Atlantic (PE-NB-NL-NS) |
$21.11 |
$41.05 |
$10.84 |
$73.00 |
1.2% |
|
Canada-Ontario |
$24.27 |
$41.05 |
$12.31 |
$77.63 |
1.2% |
|
Canada-Quebec |
$22.29 |
$41.05 |
$11.40 |
$74.74 |
1.2% |
|
Canada-West (BC-MB-SK) |
$23.26 |
$41.05 |
$11.85 |
$76.15 |
1.2% |
|
Chile |
$6.07 |
$39.83 |
$4.23 |
$50.13 |
-0.5% |
|
China |
$11.06 |
$32.31 |
$6.20 |
$49.57 |
-5.0% |
|
China-Central-Hubei-Wuhan |
$9.26 |
$32.31 |
$5.42 |
$46.99 |
-4.5% |
|
China-East-Jiangsu-Suzhou |
$11.35 |
$32.31 |
$6.33 |
$50.00 |
-5.1% |
|
China-East-Shandong-Qingdao |
$9.58 |
$32.31 |
$5.55 |
$47.44 |
-4.6% |
|
China-East-Shanghai |
$14.25 |
$32.31 |
$9.73 |
$56.29 |
-6.1% |
|
China-East-Zhejiang-Hangzhou |
$11.75 |
$32.31 |
$6.51 |
$50.58 |
-5.2% |
|
China-North-Beijing |
$19.76 |
$32.31 |
$10.45 |
$62.52 |
-6.9% |
|
China-North-Hebei-Tianjin |
$8.64 |
$32.31 |
$5.13 |
$46.09 |
-4.3% |
|
China-Northeast-Liaoning-Dalian |
$8.52 |
$32.31 |
$5.09 |
$45.91 |
-4.3% |
|
China-SouthCentral-Guangdong-Guangzhou |
$11.39 |
$32.31 |
$6.36 |
$50.07 |
-5.1% |
|
China-Southwest-Chongqing |
$8.83 |
$32.31 |
$5.89 |
$47.02 |
-4.5% |
|
China-Southwest-Sichuan-Chengdu |
$9.70 |
$32.31 |
$5.61 |
$47.62 |
-4.7% |
|
Czech Republic |
$18.69 |
$41.42 |
$9.63 |
$69.74 |
3.6% |
|
Denmark |
$51.92 |
$53.11 |
$24.22 |
$129.25 |
2.5% |
|
Eastern Europe |
$16.97 |
$46.97 |
$8.83 |
$72.77 |
2.6% |
|
Finland |
$34.12 |
$39.73 |
$16.34 |
$90.19 |
2.2% |
|
France |
$43.88 |
$51.14 |
$20.66 |
$115.69 |
2.3% |
|
Germany |
$39.07 |
$53.28 |
$18.81 |
$111.16 |
2.6% |
|
Hungary |
$14.31 |
$45.31 |
$7.62 |
$67.25 |
2.4% |
|
India |
$2.11 |
$37.73 |
$2.50 |
$42.34 |
-0.1% |
|
India-Delhi |
$2.33 |
$37.73 |
$2.63 |
$42.70 |
-0.1% |
|
India-Karnataka |
$2.71 |
$37.73 |
$3.00 |
$43.44 |
-0.1% |
|
India-Maharashtra |
$2.57 |
$37.73 |
$2.85 |
$43.15 |
-0.1% |
|
India-West Bengal |
$2.46 |
$37.73 |
$2.73 |
$42.93 |
-0.1% |
|
Indonesia |
$1.21 |
$33.84 |
$1.86 |
$36.91 |
0.2% |
|
Ireland |
$40.60 |
$49.29 |
$19.24 |
$109.13 |
6.1% |
|
Israel |
$21.82 |
$39.39 |
$11.21 |
$72.42 |
2.7% |
|
Italy |
$25.88 |
$71.35 |
$12.70 |
$109.93 |
2.9% |
|
Japan |
$14.67 |
$44.03 |
$8.92 |
$67.62 |
0.1% |
|
Malaysia |
$4.59 |
$38.75 |
$3.45 |
$46.79 |
0.9% |
|
Mexico |
$6.46 |
$54.28 |
$4.33 |
$65.07 |
1.9% |
|
Mexico-Mexico City |
$8.77 |
$54.28 |
$5.49 |
$68.54 |
2.0% |
|
Mexico-North |
$7.01 |
$54.28 |
$4.59 |
$65.87 |
1.9% |
|
Mexico-South-West |
$5.11 |
$54.28 |
$3.70 |
$63.09 |
1.8% |
|
Morocco |
$11.57 |
$33.91 |
$6.91 |
$52.40 |
2.5% |
|
Netherlands |
$38.52 |
$48.20 |
$18.43 |
$105.15 |
2.4% |
|
Norway |
$44.97 |
$43.32 |
$21.38 |
$109.67 |
4.3% |
|
Philippines |
$2.08 |
$44.28 |
$2.33 |
$48.69 |
0.7% |
|
Poland |
$18.56 |
$42.84 |
$9.39 |
$70.79 |
2.5% |
|
Portugal |
$14.98 |
$43.77 |
$8.28 |
$67.03 |
1.8% |
|
Romania |
$13.93 |
$51.33 |
$7.53 |
$72.79 |
3.3% |
|
Russia |
$6.77 |
$39.98 |
$4.65 |
$51.41 |
0.7% |
|
Russia-Altaiski Krai |
$4.22 |
$39.98 |
$3.21 |
$47.41 |
0.7% |
|
Russia-City of Moscow |
$12.32 |
$39.98 |
$8.47 |
$60.77 |
0.7% |
|
Russia-Kaluga |
$6.18 |
$39.98 |
$4.24 |
$50.40 |
0.7% |
|
Russia-Leningrad |
$7.13 |
$39.98 |
$4.91 |
$52.03 |
0.7% |
|
Russia-Moscow region |
$8.54 |
$39.98 |
$5.87 |
$54.39 |
0.7% |
|
Russia-Republic of Dagestan |
$3.71 |
$39.98 |
$2.98 |
$46.66 |
0.7% |
|
Russia-Saint Petersburg |
$9.70 |
$39.98 |
$6.36 |
$56.04 |
0.7% |
|
Russia-Sverdlovsk |
$7.15 |
$39.98 |
$4.92 |
$52.05 |
0.7% |
|
Russia-Tyumen |
$16.89 |
$39.98 |
$11.65 |
$68.52 |
0.7% |
|
Russia-Udmurtia |
$4.90 |
$39.98 |
$3.50 |
$48.38 |
0.7% |
|
Saudi Arabia |
$12.03 |
$33.73 |
$7.07 |
$52.83 |
-0.1% |
|
Singapore |
$30.32 |
$61.75 |
$15.17 |
$107.23 |
1.4% |
|
Slovakia |
$16.30 |
$58.28 |
$8.70 |
$83.29 |
2.1% |
|
South Africa |
$7.16 |
$40.12 |
$4.82 |
$52.10 |
0.4% |
|
South Korea |
$22.98 |
$39.25 |
$11.72 |
$73.95 |
3.3% |
|
Spain |
$19.76 |
$40.01 |
$10.31 |
$70.07 |
1.9% |
|
Sweden |
$29.98 |
$41.86 |
$14.80 |
$86.63 |
1.3% |
|
Switzerland |
$67.72 |
$60.81 |
$25.53 |
$154.05 |
7.4% |
|
Taiwan |
$10.16 |
$43.01 |
$6.28 |
$59.46 |
-0.2% |
|
Thailand |
$2.37 |
$35.80 |
$2.49 |
$40.66 |
0.9% |
|
Tunisia |
$1.66 |
$36.36 |
$1.98 |
$40.00 |
1.2% |
|
Turkey |
$3.97 |
$93.84 |
$4.19 |
$102.00 |
0.2% |
|
USA |
$39.72 |
$46.66 |
$19.23 |
$105.60 |
0.9% |
|
USA-California |
$46.14 |
$46.66 |
$22.33 |
$115.12 |
0.9% |
|
USA-Central (AR-IA-KS-MT-NE-ND-OK-SD) |
$31.50 |
$46.66 |
$15.32 |
$93.48 |
0.9% |
|
USA-Mid-Atlantic (DE-MD-PA-VA) |
$41.54 |
$46.66 |
$20.11 |
$108.30 |
0.9% |
|
USA-Mountain (AZ-CO-ID-NV-NM-UT-WY) |
$35.19 |
$46.66 |
$17.05 |
$98.90 |
0.9% |
|
USA-North Central (IL-MI-MN-OH-WI) |
$38.02 |
$46.66 |
$18.41 |
$103.09 |
0.9% |
|
USA-Northeast (MA-NY-NJ-CT) |
$49.32 |
$46.66 |
$23.88 |
$119.86 |
0.8% |
|
USA-Northeast-Rural (ME-NH-RI-VT) |
$35.80 |
$46.66 |
$17.35 |
$99.81 |
0.9% |
|
USA-Pacific (WA-OR-HI-AK) |
$37.62 |
$46.66 |
$18.21 |
$102.49 |
0.9% |
|
USA-Southeast |
$33.72 |
$46.66 |
$16.35 |
$96.73 |
0.9% |
|
USA-Texas |
$39.96 |
$46.66 |
$19.35 |
$105.97 |
0.9% |
|
United Kingdom |
$29.14 |
$55.81 |
$14.83 |
$99.78 |
2.0% |
|
Vietnam |
$1.87 |
$39.21 |
$2.30 |
$43.38 |
0.6% |
|
Western Europe |
$35.20 |
$52.02 |
$16.94 |
$104.16 |
2.9% |
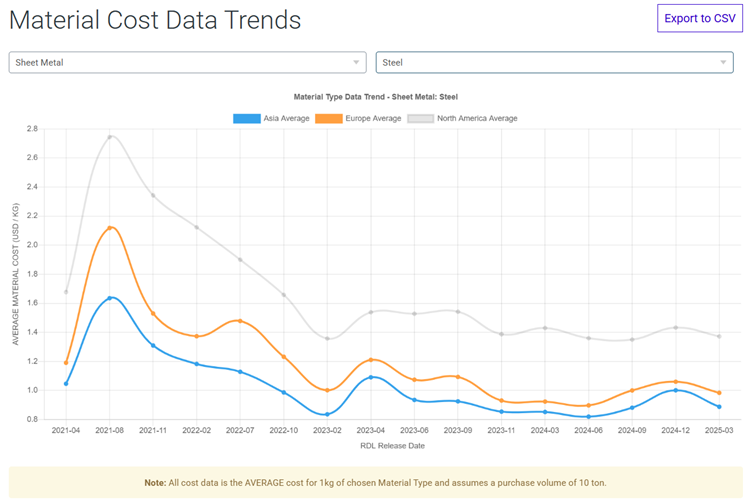
Material Rates
The following table represents changes in material rates at a world average level, due to general market conditions, when comparing the 2025-09 RDLs to the 2025-06 RDLs.
| Non-Ferrous | Ferrous Metals | Plastics | |||
|---|---|---|---|---|---|
|
Aluminum |
12.6% |
Galvanized Steel |
-2.2% |
HDPE - Extrusion Sheet |
6.0% |
|
Aluminum Bronze |
8.4% |
Low-Alloy Steel |
-1.9% |
PP - Extrusion Sheet |
-0.9% |
|
Brass |
9.2% |
Malleable Cast Iron |
0.1% |
PS - Crystal Injection GP |
2.6% |
|
Bronze |
9.4% |
Stainless Steel |
1.4% |
PS - High Impact Extrusion |
2.5% |
|
Copper |
6.5% |
Steel |
-1.5% |
Polypropylene |
-0.8% |
|
Heat Resistant Super Alloys |
5.2% |
Unalloyed Steel |
-2.0% |
Polystyrene |
2.4% |
|
Magnesium |
4.4% |
|
|
||
|
Titanium |
2.1% |
|
|
||
|
Zinc |
8.6% |
|
|
||
|
Zinc-Aluminum |
9.3% |
|
|
||
For a more in-depth regional breakdown of changes in material rates, please view aPriori's Material Cost Data Trends page. This page breaks material costs down into our Asia, Europe, and North American regions. Below is an example image showing the trends of steel prices per region up to the release of 2025-03 RDLs.