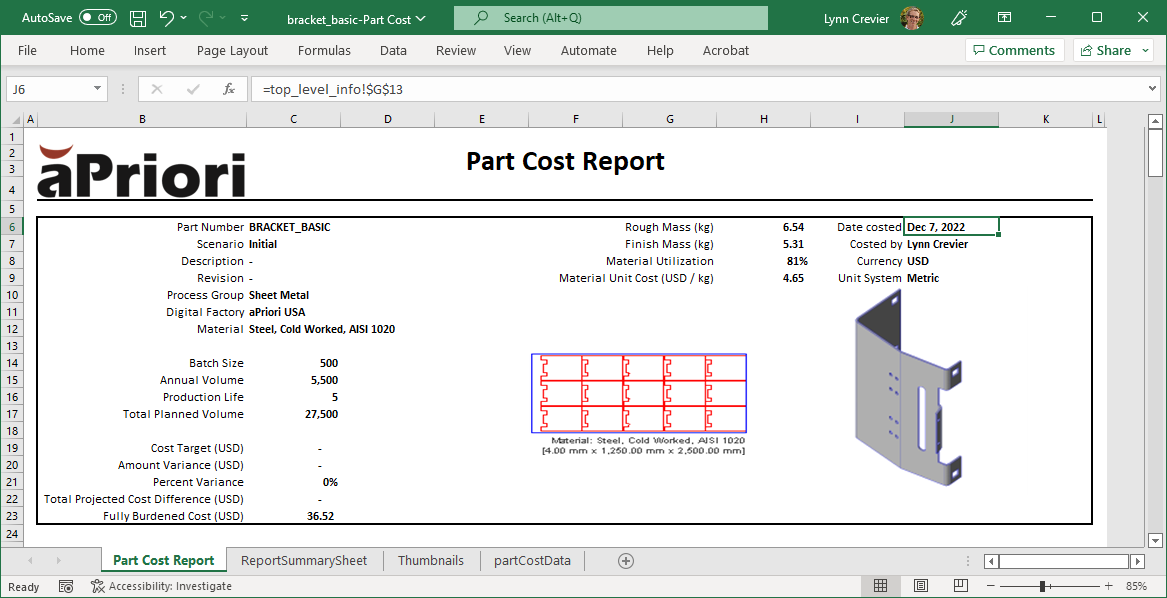
You can include and configure thumbnail images of components and, as applicable, nesting diagrams in your reports. For example, this Part Cost Report is a spreadsheet report that contains a nesting diagram thumbnail and 3D image thumbnail for a sheet metal part.
To include thumbnail images of components, add these attributes to the <reports> tag in the system defined XML file (For more information about the system defined XML file, see Custom Spreadsheet Reports.):
-
generateThumbnails – Boolean specified as either:
-
true– Component image included. -
false– Component image not included.
-
-
imageFormat– Component image format specified as either:-
PNG(default) -
JPEG
-
-
jpegQuality– Image quality specified as a real number between zero and one (0.0 <= value <= 1.0, Java default of 0.75 if unspecified) -
thumbnailWidth– Component image width in pixels specified as a positive real number (default: 184). -
thumbnailHeight– Component image width in pixels specified as a positive real number (default: 184).To include thumbnail images of components, add these attributes to the <reports> tag in the XML file:
For example
<reports
generateThumbnails="true"
imageFormat="JPEG"
jpegQuality="0.85"
thumbnailWidth="200"
thumbnailHeight="200"
>
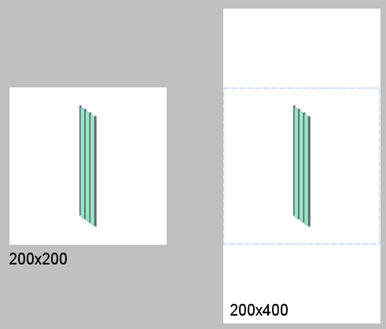
If only the width or height dimension is specified, aP Pro generates a square thumbnail that uses the specified width or height for both dimensions.
If only one dimension is changed, the area that includes the image changes, but the image does not change. For example, this figure shows the difference in how an image displays when only the height changes.
To include a nesting diagram (as applicable), in addition to the any other image attributes that you want to speicify, add these attributes to the <reports> tag in the XML file.
-
nestingThumbnailTrim– Boolean specified as either:-
true– Trim is included and the image width or height is automatically adjusted to remove any unused space at the left or top of the image and the values specified fornestingThumbnailWidthandnestingThumbnailHeightbecome maximum values instead of absolute values. -
false(default) – Trim is not included unless eithernestingThumbnailWidthornestingThumbnailHeightis set to zero, in which case thenestingThumbnailTrimattribute is implicitly enabled.
-
-
nestingThumbnailWidth– Nesting diagram image width in pixels specified as a positive real number (default: 184). If set to zero, thenestingThumbnailTrimattribute is implicitly enabled and the image width is determined automatically after fitting the diagram to the specified image height. If thenestingThumbnailTrimis set to"true", and a positive non-zero value is specified, the value is used as the maximum image width in pixels. -
nestingThumbnailHeight– Nesting diagram image height in pixels specified as a positive real number (default: 184). If set to zero, thenestingThumbnailTrimattribute is implicitly enabled and the image height is determined automatically after fitting the diagram to the specified image width. If thenestingThumbnailTrimis set to"true", and a positive non-zero value is specified, the value is used as the maximum image height in pixels. -
nestingThumbnailFontSize– Size of the material/stock text in points specified as a non-negative real number (default: 9). Setting this attribute to zero suppresses the text entirely. -
nestingThumbnailGutter– Boolean specified as either:-
true(default) – A strip of whitespace is included to the right of the image in the context of sheet nesting. With strip nesting, the zig-zag continuation indicator fills this space. -
false– A strip of whitespace is included to the right of the image in the context of sheet nesting. With strip nesting, the zig-zag continuation indicator fills this space.
By default this gutter is included for backwards compatibility with existing spreadsheet reports (to avoid the right-hand edge of the image being cut off in certain situations)
-
For example, to add PNG images of both the component and the nesting diagram, you could add this code to the XML file:
<reports
generateThumbnails="true"
imageFormat="PNG"
thumbnailHeight="200"
nestingThumbnailTrim="true"nestingThumbnailFontSize="10">
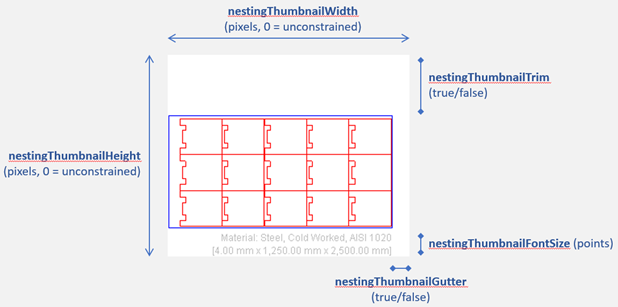
This figure shows how each nesting thumbnail attribute is applied to a nesting diagram thumbnail.
In Excel format, adding the attributes yields:
-
A new tab called "Thumbnails" containing the images.
-
A table in the cost summary sheet containing the mapping from the scenario name to the name of the image in Excel.
In XML format, the <Scenario> element has "thumbnail" attributes containing references to the associated .png or .jpg image file(s). The image files themselves are generated in the same directory as the XML.
In CSV format, the .png or .jpg image files are written to the same directory as the .csv files. The CSV files themselves don't reference the image files.