Sustainability spreadsheet reports
aPriori spreadsheet reports extract data from a scenario and present it in an Excel spreadsheet.
This page describes the system-defined spreadsheet reports which have sustainability data, which are:
-
Carbon Driver Report
For the active part scenario, shows carbon data, with charts for Total Carbon and Process CO2. -
Cost Driver Report
For the active part scenario, shows which types of costs dominate the overall cost and which processes and features (GCDs) are the most time-consuming and therefore costly. Carbon data is in two spreadsheet worksheets, and the Carbon Driver Report tab. -
Roll-up Summary Report
Compares the CO2e produced and costs for the part scenarios included in the active roll-up. -
Cost Comparison Report
Compares the carbon data and costs for each part scenario included in the active comparison. -
Part Cost Report
Shows the carbon data and the cost of the processes associated with manufacturing the active part. -
Assembly Summary Report
Shows carbon data for assembly processes and each subcomponent in the Assembly.
You can also create custom spreadsheet reports. For more information, see: Custom Spreadsheet Reports.
Requirements
To enter and analyze sustainability data, you must have an aPriori Sustainability License and aP Pro 2023 R1 or later.
Limitations
-
aP Pro does not yet support Sustainability analysis for all process groups. For a list of currently supported process groups, see Processes supported in Sustainability.
-
Carbon from product use, tooling, and end-of-life is not currently considered.
Prerequisites
Spreadsheet reports need scenarios from which to extract data. The Roll-up Summary Report needs a roll-up from which to extract data.
Procedure
Generate a report
-
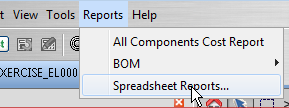
To generate a spreadsheet report in aP Pro, select Reports > Spreadsheet Reports ..., and select a report.
You can run Spreadsheet Reports from the Command Line Interface (CLI). For more information, see: Running from the Command Line.
Carbon Driver Report
The Carbon Driver Report is part of the Cost Driver Report.
Generate a Carbon Driver Report
In aP Pro, to generate a Carbon Driver Report:
-
Select (Reports > Spreadsheet Reports...: select Cost Driver)
-
Save the spreadsheet file.
Contents of Carbon Driver Report
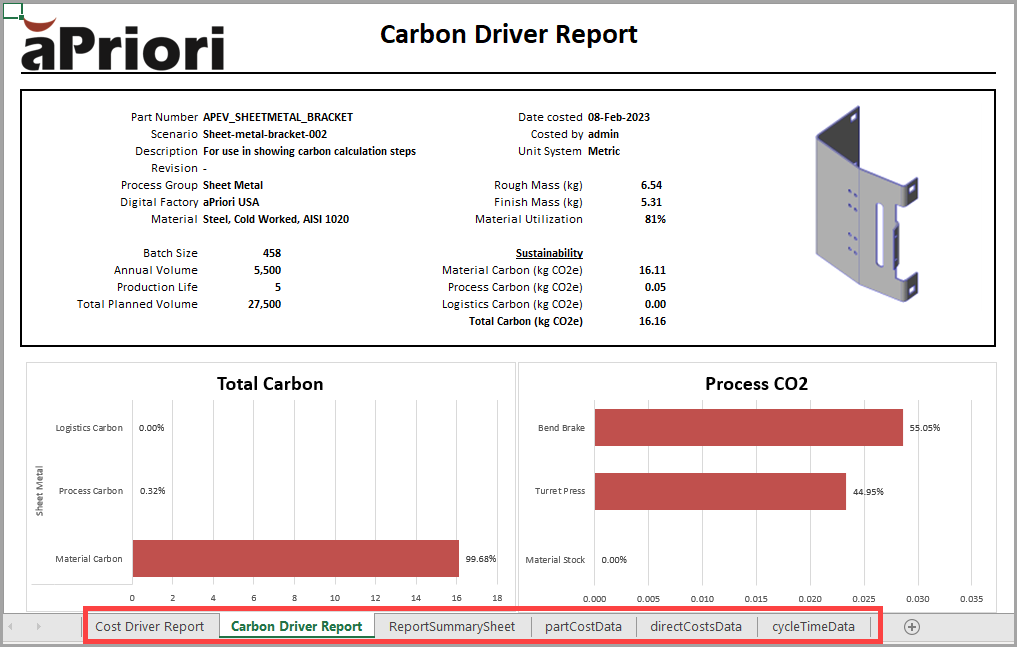
The Carbon Driver Report tab has carbon data in the Sustainability section, and in the Total Carbon and Process CO2 graphs.
The partCostData tab has details of material carbon and process carbon.
In the cycleTimeData tab has data on cycle times, which influence process carbon.
Cost Driver Report
The Cost Driver Report includes the Carbon Driver Report.
Generate a Cost Driver Report
In aP Pro, to generate a Cost Driver Report:
-
Select (Reports > Spreadsheet Reports...: select Cost Driver)
-
Save the spreadsheet file.
Contents of Cost Driver Report
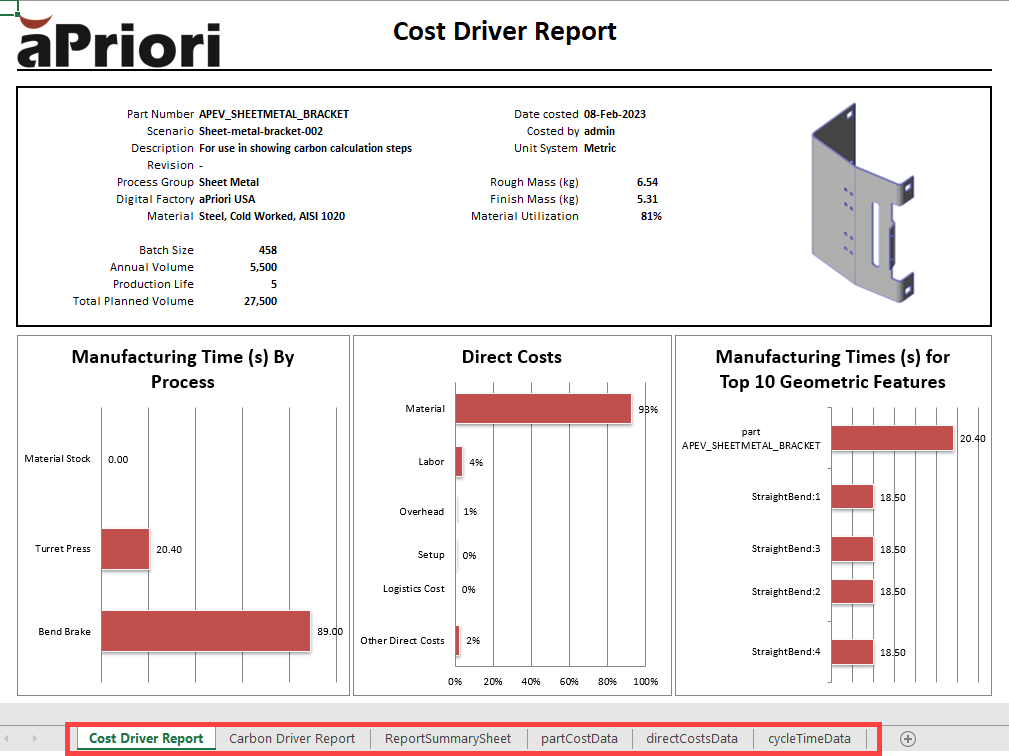
The Cost Driver Report tab has data on manufacturing times by process and manufacturing times by GCD, which can help you see cost outliers and potential carbon outliers.
The partCostData tab has details of material carbon and process carbon.
In the cycleTimeData tab has data on cycle times, which influence process carbon.
When you generate the Cost Driver Report, it also includes the Carbon Driver Report.
Roll-up Summary Report
Generate a Roll-up Summary Report
In aP Pro, to generate a Roll-up Summary Report:
-
Select (Reports > Spreadsheet Reports...: select Roll-up Summary Report)
-
Save the spreadsheet file.
Contents of the Roll-up Summary Report
The Roll-up Summary Report shows only the first level items in the roll-up. To view additional details on individual parts, use other reports in aPriori. For example, to see individual part process CO2e, generate the Part Cost Report on the part of interest.
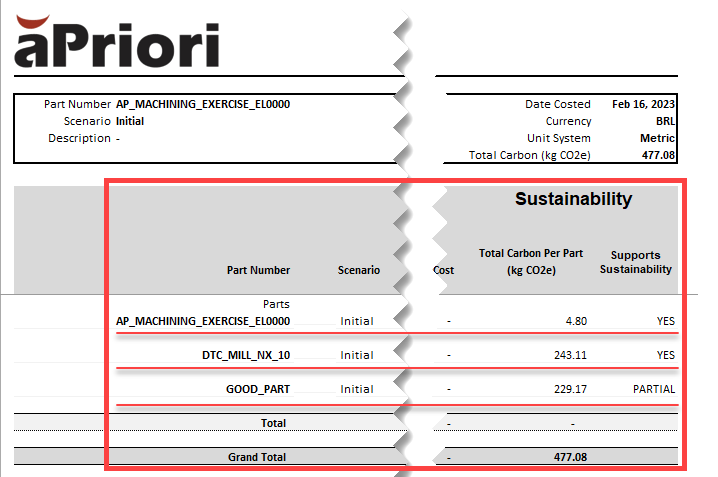
The Roll-up Summary Report has the following Sustainability information for each first level item in the roll-up:
-
Total Carbon Per Part (kg CO2e or lb CO2e)
-
Supports Sustainability, with these options:
- Yes: aPriori Sustainability has carbon data for the materials and processes used.
-
Partial: aPriori Sustainability has carbon data for some of the materials and processes used. This means that the routing includes a mix of supported and unsupported processes.
-
No: aPriori Sustainability has no carbon data for the materials and processes used.
-
Grand Total
The sum of the Total Carbon Per Part values
This cropped image shows the Parts and Sustainability section of the example Roll-up Summary Report), that shows Sustainability information in the report.
Cost Comparison Report
Generate a Cost Comparison Report
In aP Pro, from the active Comparison Summary, to generate a Cost Comparison Report:
-
Select (Reports > Spreadsheet Reports...: select Cost Comparison Report)
-
Save the spreadsheet file.
Contents of Cost Comparison Report
This cropped image of a Cost Comparison Report in Excel for three part scenarios shows the carbon data fields at the bottom of the report.
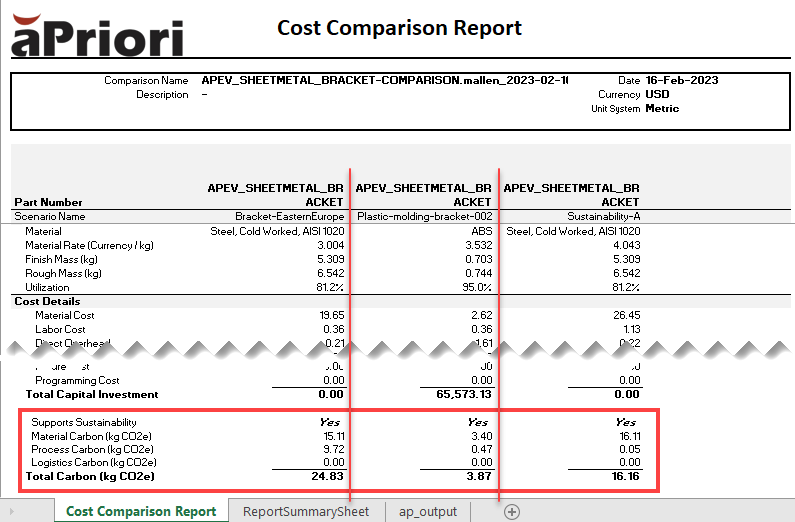
The Cost Comparison Report tab has cost and carbon data for each part of the active comparison.
The apOutput tab has details of Material Carbon, Process Carbon, Logistics Carbon, and Total Carbon for each part in the comparison.
Part Cost Report
In aP Pro, to generate a Part Cost Report:
-
Select (Reports > Spreadsheet Reports...: select Part Cost Report)
-
Save the spreadsheet file.
Contents of Part Cost Report
This cropped image of a Part Cost Report in Excel shows the carbon data fields at the bottom of the report.
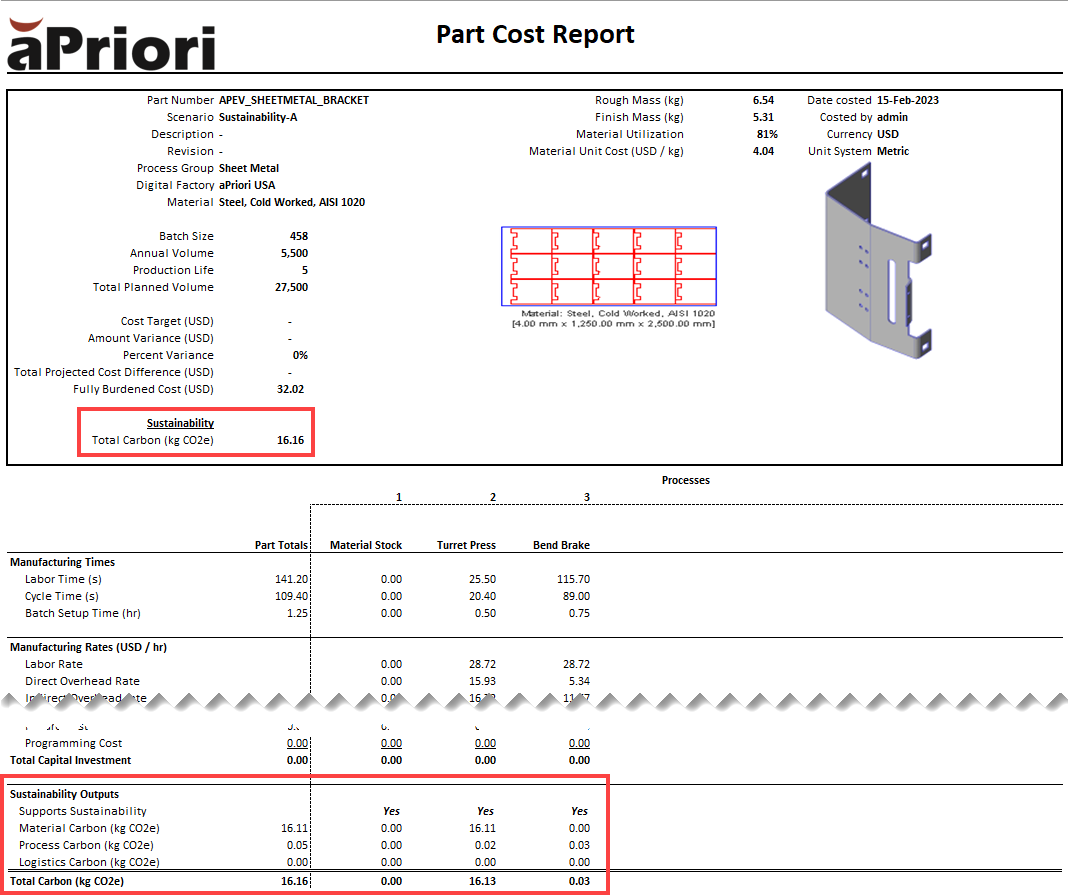
The Part Cost Report tab has carbon data and the cost of the processes associated with manufacturing the active part Total Carbon is also shown in the header section.
Assembly Summary Report
You can examine carbon data for assembly processes and each subcomponent in the Assembly.
Generate an Assembly Summary Report
In aP Pro, to generate an Assembly Summary Report:
-
Select (Reports > Spreadsheet Reports...: select Assembly Summary Report).
-
Save the spreadsheet file.
Contents of the Assembly Summary Report
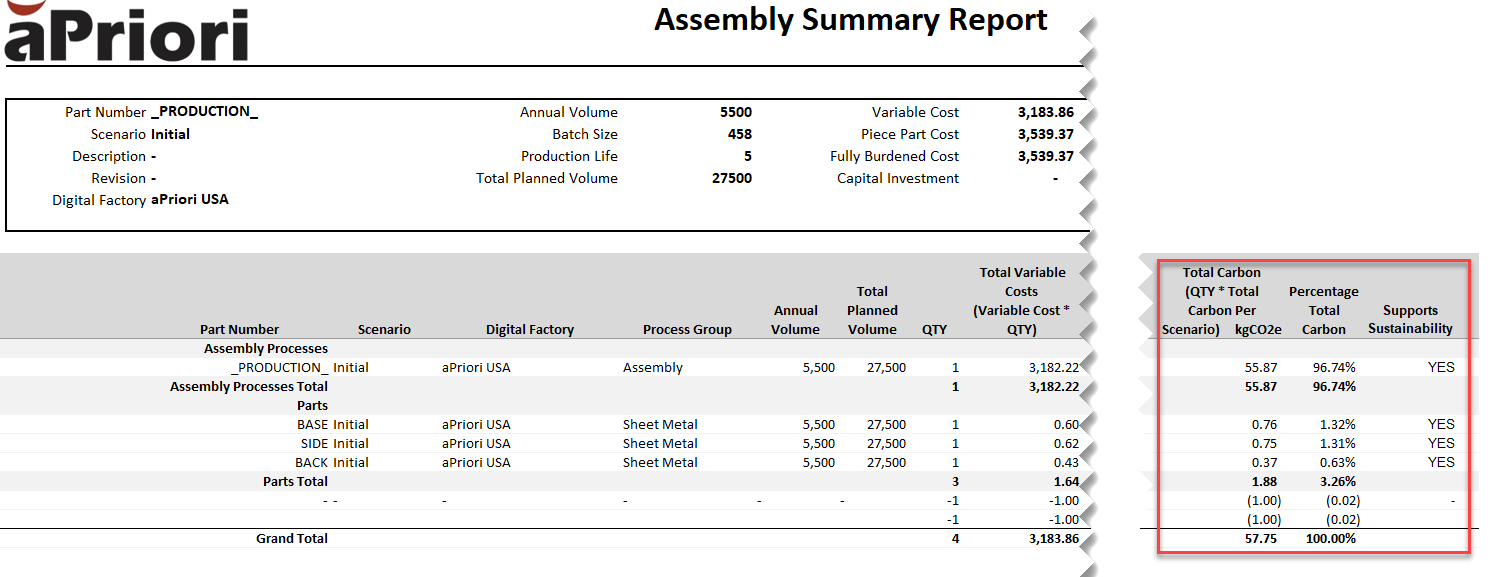
This cropped image of an Assembly Summary Report in Excel shows the carbon data fields at the right side of the report.
You can view the following details:
-
Total Carbon (QTY * Total Carbon Per Scenario): the total carbon contribution of each individual process or subcomponent.
-
Percentage Total Carbon: the percentage contribution of each process or subcomponent to the overall Assembly’s embodied carbon footprint.
-
Supports Sustainability: the sustainability status for each entry, indicating the sustainability coverage of the Assembly and subcomponents.
For more information about Sustainability data for the Assembly process group, see the topic 'Sustainability Data for Assembly' in the Cost Model Guide.

