Design Analysis
Identify High-Value Redesigns
Unless the component you are designing is an NPI/NPD part or it has re-entered the design cycle due to a quality or performance issue, you must decide what components are worth your time redesigning.
For example, a redesign may be necessary because a component is over cost and has a large opportunity for future savings, or because it contains multiple DFM issues causing engineering problems for your supplier or manufacturing team. Removing such issues may reduce cost and risk.
To identify components you should work on, we have a few basic rules, and aPriori provides analysis tools to indicate what may be worth investigating.
Aside from the obvious “manufacturing is always asking for deviations on this part” (indication of DFM issues), or when it has been made clear to you that a part is driving the cost of the product disproportionately, we recommend that you start your selection process by asking the following questions:
-
Which parts that I am responsible for have a significant production forecast in future years AND the projected spend (Cost x Production Volume) is so significant that a potential reduction of 10% would be worth the redesign effort. Typically, this would equate to > $25,000 in savings.
-
Are there commercial/legal reasons that the component could not be manufactured using an alternative design? For example, would a redesign require a re-certification which would drive the implementation cost excessively high? If yes, eliminate those components/parts from the equation.
Gather The Data You Need
After you have the parts you want to analyze, you need to group them by process, cost and publish them in aP Design. To do that you will need the CAD file, 2D drawing, and approximate production volume.
Tip: Note: When costing use the same average batch size for all parts.
After you collect this data, segregate the parts by manufacturing process and material type; Sheet Metal Parts, Castings (including Machined Castings), Forgings, Injection Molding, etc. Secondly, segregate by material types – ABS, Nylons, PETs, and so on, or Steels, Ti, AL, and so on.
Create Projects in aP Workspace
Now you have identified groups of parts to analyze:
-
Open aP Workspace and create a project containing each sub-group of components. See Collaborate Using Projects.
-
Add a colleagues who has access to aP Pro to the project, then ask them to create a roll-up (data set) of the components using aP Pro, to allow export of these components into aP Analytics. See the Roll-ups, Dynamic Roll-ups, and Functional Groups section in the aP Pro User Guide.
-
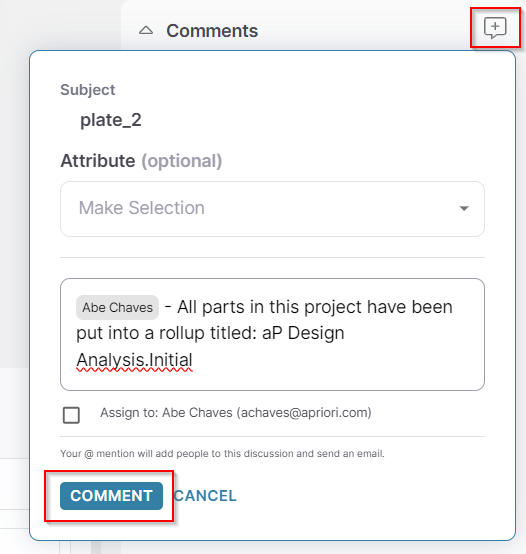
The aP Pro user should comment on one of the scenarios within the project to let the design user know the task is complete. See Collaborate Using Messages and Comments.
-
You can now export the roll-ups to our aP Analytics analysis tool - see Managing Scenario Export and Purge in aP Admin.
Tip: You may need to request permission from your system administrator to allow you to export this data.
Conduct The Analysis
There are several analyses you can run to investigate which components are worth redesign. aPriori provides these analysis reports within the aP Analytics Library. Usage of the reports is dependent upon having exported your data set (roll-up).
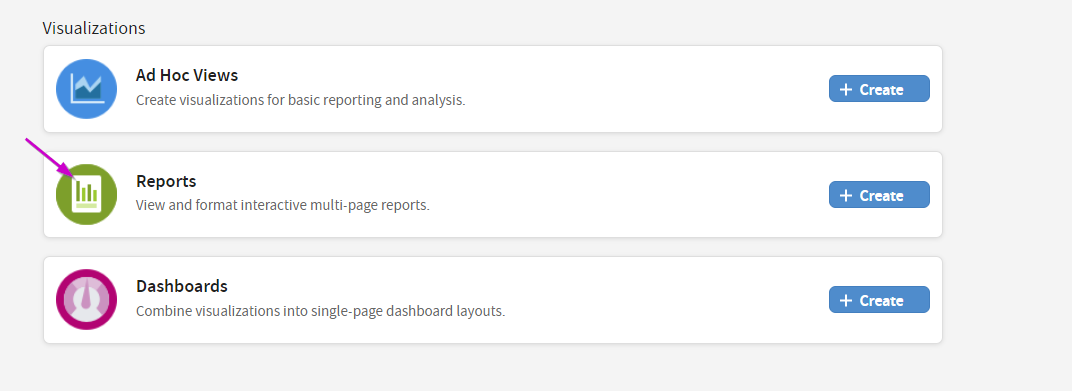
Design outlier report or DTC for Design to Cost shows which parts are more expensive relative to their peers. This report is available for Machined, Sheet Metal, Casting, and Plastic parts and can be found in the section of aP Analytics called Reports.
-
Click Reports to open the repository of reports in aP Analytics.
-
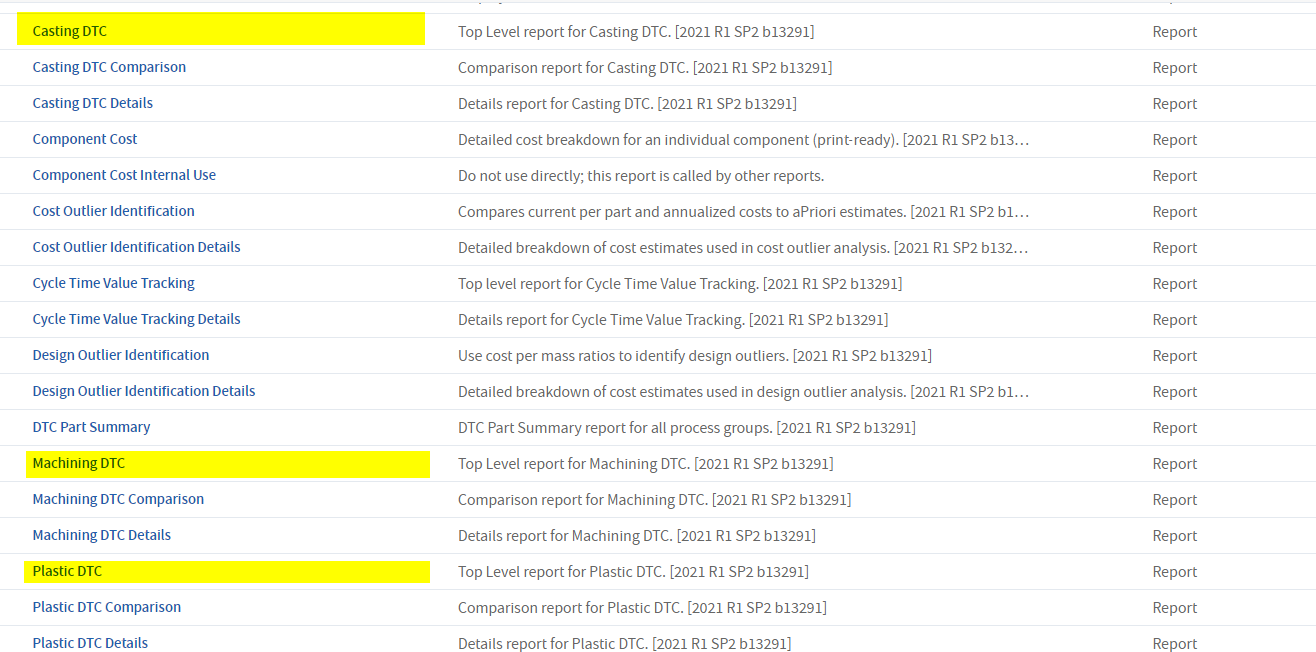
Scroll down the list until you see the report that matches the process of your data set:
-
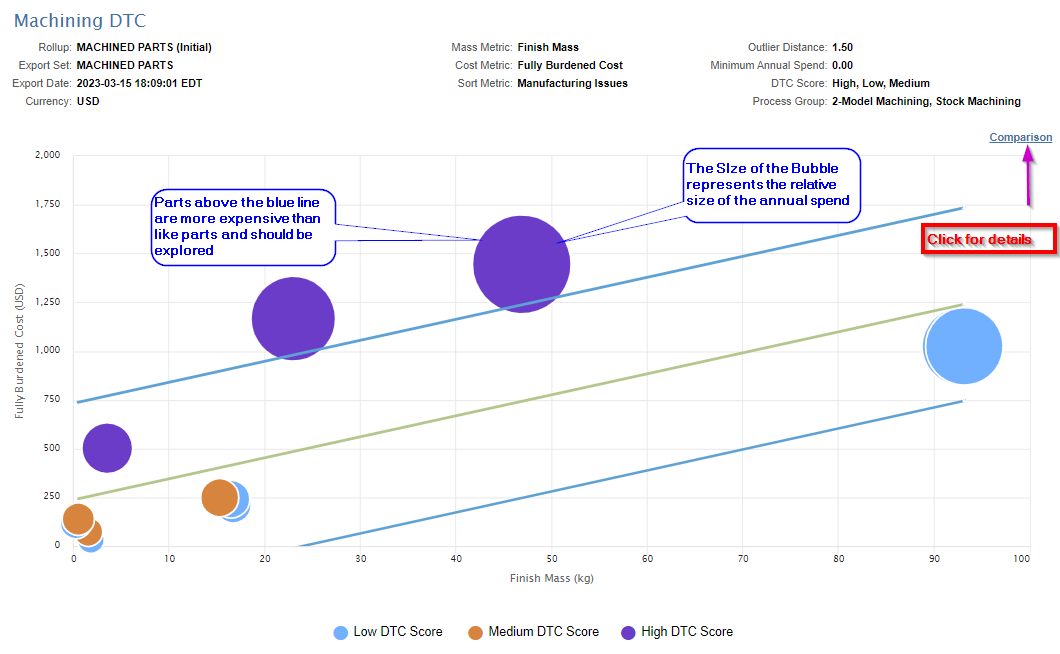
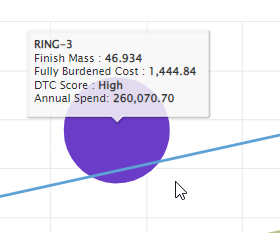
This is your first report and provides a general feel for where the parts you have selected fall relative to each other in terms of cost and manufacturability, so we recommend running it first. See report below:
-
Hovering over the circles shows you the part number and details of cost, annual spend, mass, and so on. Clicking on it shows you the part and details about the part cost. The color of the bubble indicates the number of DFM issues in that part relative to the others being analyzed.
In this example, based on these first results there are two parts to review:
-
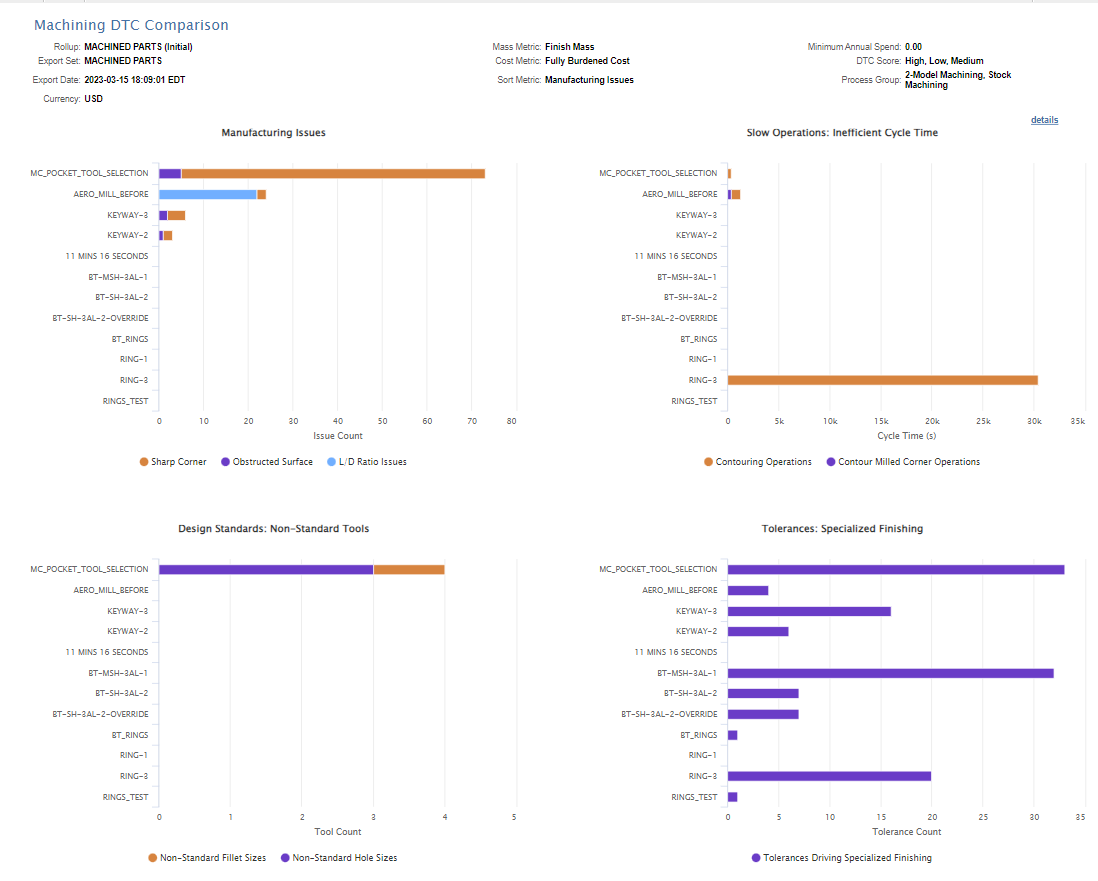
Click the Comparison link to get your second Report showing the DFM issues for this set of parts. Note that the issues will vary based on the manufacturing process. Here you can see the Machining issues. If these were plastic parts, you would see issues such as draft angles and thickness violations.
Next Steps
You can see from the results above that the part called MC_POCKET is consistently at the top. Another bubble, RING-3, appears to have a lot of slow operations on the top left chart. The third part worth exploring for redesign is AERO MILL BEFORE, as this has multiple L/D ratio type of DFM issues.
So, of the 12 parts, only 3 are worth exploring.
Alternative Approach: Design Analysis Using aP Pro
You can also use our aP Pro tool to conduct design analysis - see the Design Analysis tutorial for aP Pro.