Filter the Discovery Dashboard
Filters apply globally across all visualizations and the Designs table. Applied filters are displayed at the top of the dashboard.
Apply a filter then click to refresh the dashboard.
Keyboard shortcut
Press Ctrl+Alt+R at any time to reset all filters.
Tabs
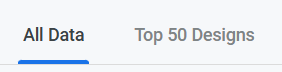
The dashboard has two tabs with separate Time Range filters:
| Tab | Description |
|---|---|
| All Data | Shows all eligible designs for your organization, subject to applied filters. |
| Top 50 Designs | Pre-filtered to the top 50 designs by cost optimization for the previous year. Selecting an additional filter when this tab is selected does not recalculate the top 50 ranking; instead it filters rows out of the original top 50, leaving fewer rows. |
Available Filters

| Filter | Applies To | Control | Options / Default | Notes |
|---|---|---|---|---|
| Time Range | All Data | Dropdown, single selection | 1 month, 3 months, 6 months, Year to Date, 1 Year, 2 Years, 5 Years. Default: 1 Year | Based on final iteration creation date. Does not affect the Top 50 Designs tab. |
| Time Range | Top 50 Designs | Dropdown, single selection | 1 month, 3 months, 6 months, 1 Year. Default: 1 Year | The top 50 are calculated for the previous year. Shorter selections reduce the designs shown but do not recalculate the ranking. |
| Process Group | All Data, Top 50 Designs | Tag list, multiple selections | All available process groups. Default: all values | Filters by the process group of the final costing scenario. |
| Material Type | All Data, Top 50 Designs | Tag list, multiple selections | All available material types. Default: all values | Filters by the material used in the final costing scenario. |
| Annual Volume | All Data, Top 50 Designs | Tag list, multiple selections | Grouped volume ranges. Default: all values | Select one or more volume ranges to filter designs by annual production volume. |
| Optimization Range | All Data, Top 50 Designs | Tag list, multiple selections | All applicable ranges from the following: Less than $0 / $0–$10,000 / $10,001–$50,000 / $50,001–$100,000 / $100,001–$250,000 / $250,000+. Default: all values | Filters by the Cost Optimization value of each design. |
| Base to Final % Change | All Data, Top 50 Designs | Dropdown, single selection | Tiered percentage ranges (0–100%). Default: All | Uses absolute percentage values, not positive/negative. |
Filter By Selecting Values
You can also filter the dashboard by clicking values in charts or the Designs table. For example, selecting a process group in the designs table filters the dashboard to show only data for that process group.
To remove a selected-value filter, click the filter tag shown at the top of the dashboard, for example .
Keyboard shortcut
You can also press Ctrl+Alt+R at any time to reset filters.