Understand Discovery Dashboard KPIs
The KPIs shown at the top of the dashboard give a quick overview of value tracking for costed designs that have not yet been added to a project:
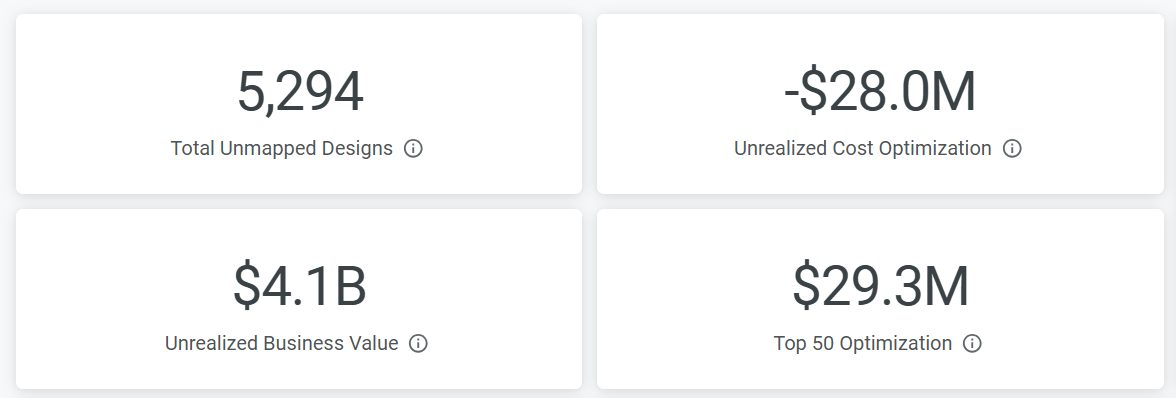
Hover over on the dashboard to view a description of each item
The total number of distinct designs that have been costed in aP Design or aP Pro but have not been added to a project.
These designs represent cost-saving opportunities that have not yet been captured in the Design Value Dashboard.
Total cost savings not recognized in the Design Value Dashboard.
Calculated as: (Base PPC − Final PPC) × Annual Volume,
summed across all costed designs that are not in a project.
The total value of costed designs that have not yet been added to a project.
This uses the same calculation as Total Business Analyzed on the Design Value Dashboard.
The total value of the top 50 costed designs that have not yet been added to a project.
The total cost optimization for the top 50 costed, non-project designs by cost optimization.
Designs by Group
The Designs by Group donut chart shows the distribution of costed, non-project designs by user group, as a percentage of the total.
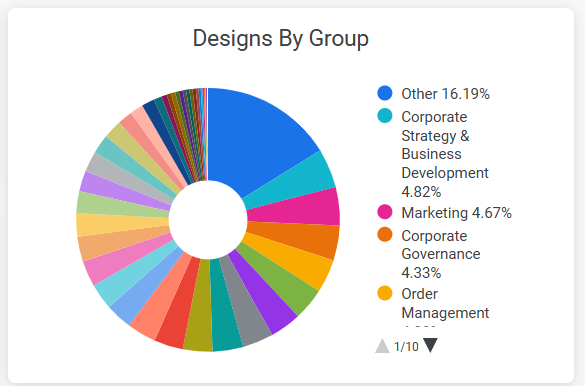
- Groups are sorted in descending order by number of designs.
- Users not assigned to a group appear as Other.
- Up to 50 groups are shown.
Use this chart to identify which groups have the most unrecognized savings potential. Clicking a segment filters the Designs table to show only designs from that group.
This data requires Department to be set in each user's Profile. See Updating and Adding Users
View Expanded Information
For each summary item, click the button to access more details:
- Click Download data to download — see Download Data.
- Click View > Expanded to see an expanded view.