Explore the Value Discovery Dashboard
The Value Discovery Dashboard identifies designs that have been costed in aP Design or aP Pro but have not yet been added to a project. These designs represent unrecognized cost savings.
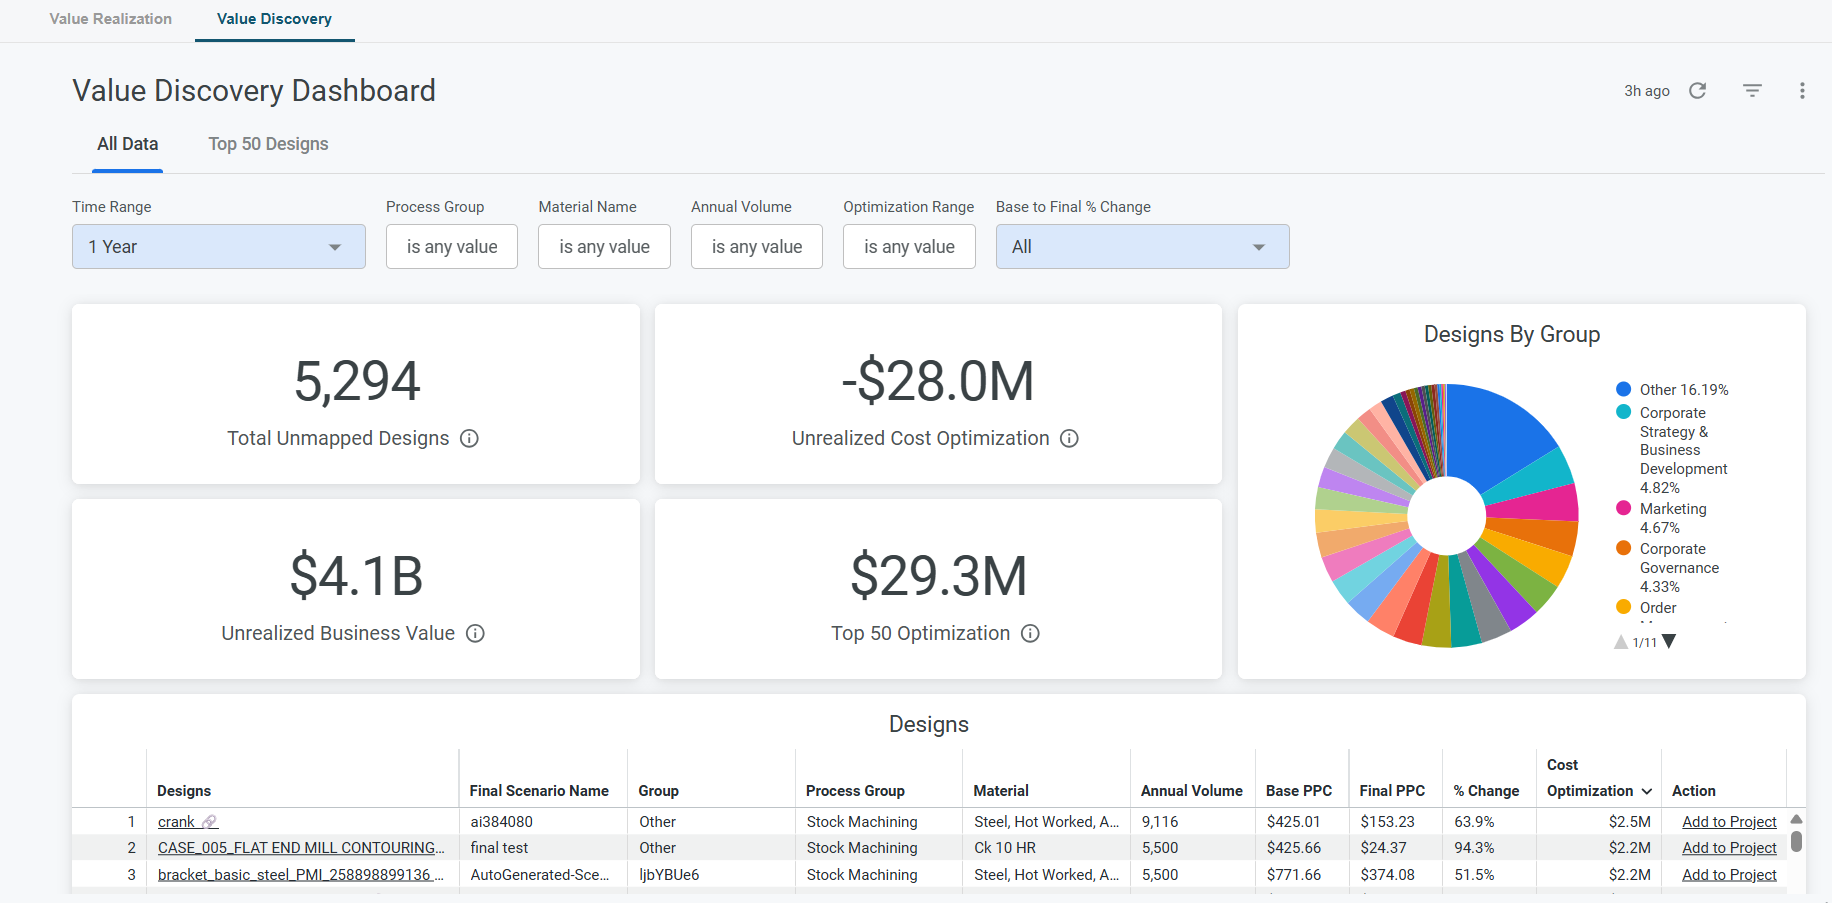
Use the Discovery Dashboard to:
- Find designs with significant cost optimization opportunities.
- Open designs in aP Design to review costing details.
- Add designs to a project so they appear in the Design Value Dashboard.
Cost Optimization
aPriori quantifies a design's cost optimization, also known as cost avoidance or cost savings, as annual volume multiplied by the difference between base cost and final cost. By default, base cost is the piece part cost for the design's initial costing and final cost is the piece part cost for the design's latest published costing. See Measure Cost Avoidance for more information.
Tabs
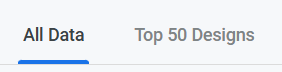
The Value Discovery Dashboard has two tabs:
| Tab | Shows |
|---|---|
| All Data | All eligible designs for your organization, subject to applied filters. |
| Top 50 Designs | The top 50 designs by cost optimization for your organization over the previous year. |
When the dashboard loads, the All Data tab is displayed.
Designs Table
The main table lists individual designs with links to open them in aP Design and to add them to a project.

The Value Discovery Dashboard refreshes every 24 hours. When you add a design to a project, the design and KPIs remain as shown in the Discovery Dashboard until a refresh occurs. Upon refresh, the design migrates to the Design Value Dashboard, and KPIs in both dashboards are updated accordingly.
See Designs Table for details.
Filters
Filter the designs shown using Time Range, Process Group, Material Type, Annual Volume, Optimization Range, and Base to Final % Change filters.

See Filters for details.
KPIs
The KPIs shown at the top of the dashboard give a quick overview of value tracking:
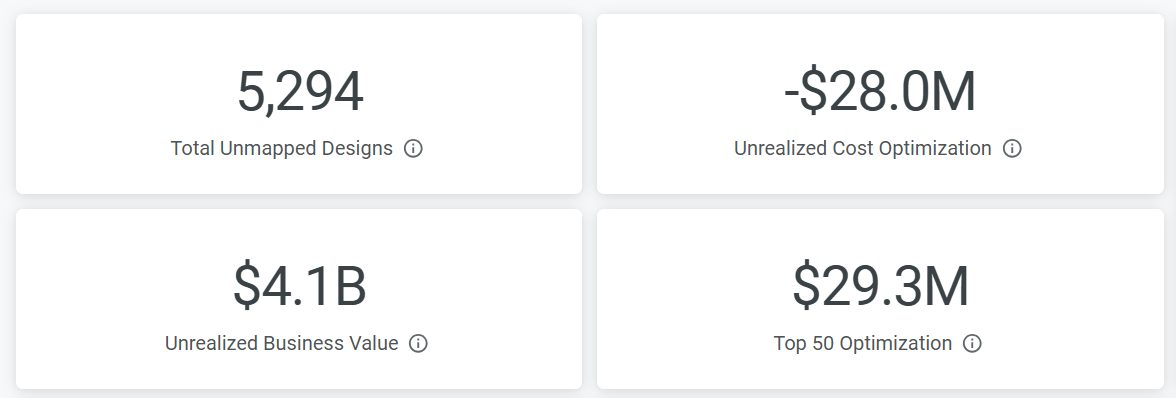
- Total Unmapped Designs
- Unrealized Cost Optimization
- Unrealized Business Value
- Top 50 Optimization
See KPIs for details.
Designs by Group
Designs by Group answers the question "How is unrecognized cost avoidance being driven or contributed to by each group within my aPriori deployment" Note: this requires Department to be set via each user's Profile.
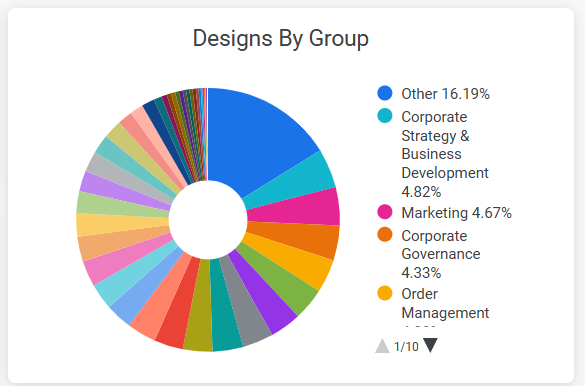
This displays the share of users contributing to final design iterations by department. Use this chart to see where design activity and value creation are focused in your organization.
See Designs by Group for details.