Cost Optimization
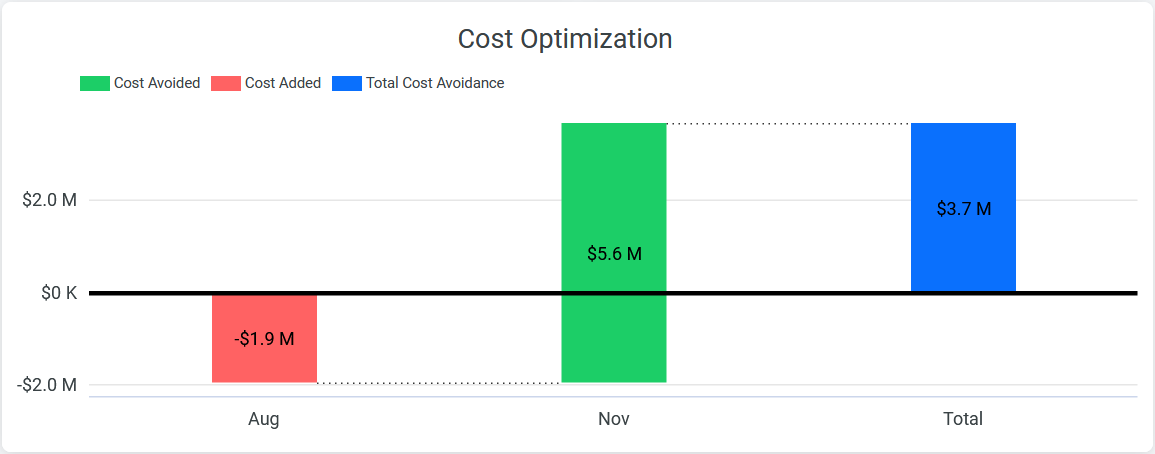
Cost Optimization visualizes cost avoided or added by calendar period, based on final iteration creation dates. Use this chart to identify which quarters or projects delivered the highest design-driven savings.
Cost Optimization
aPriori quantifies a design's cost optimization, also known as cost avoidance or cost savings, as annual volume multiplied by the difference between base cost and final cost. By default, base cost is the piece part cost for the design's initial costing and final cost is the piece part cost for the design's latest published costing. See Measure Cost Avoidance for more information.
Cost Optimization answers the question: “How is aPriori impacting optimization of cost for designs it’s being used on?”
You can use Cost Optimization information to:
- Display high-level graphs showing the value aPriori provides
- Identify non-optimized projects for you to take corrective action
Metrics shown
- Cost Avoided: Positive impact, shown in green
- Cost Added: Negative impact, shown in red
- Total Cost Avoidance: Total shown at the end of the graph in blue
Interaction
- Click a bar to filter the dashboard by this calendar period.
- To remove the filter, click the filter under Final Iteration Period at the top of the dashboard, for example