Track Progress
Track and visualize the improvements you've made to your part and how your design changes affect piece part cost over time.
View Progress
In Evaluate, select the PROGRESS button to visualize changes to piece part cost:
-
Each successful analysis creates an iteration, which appears as a data point on the chart
-
Iterations from the same scenario are connected by a continuous line
- Each scenario appears as a separate series on the chart distinguished by color
Measure Cost Avoidance
To calculate Cost Avoidance, compare two iterations:
- Base: Your starting point for comparison (often your first iteration)
- Final: Your end point for comparison (typically your most recent published and analyzed iteration)
Note
Publish a scenario to use it as the Final iteration, see Publish a Scenario
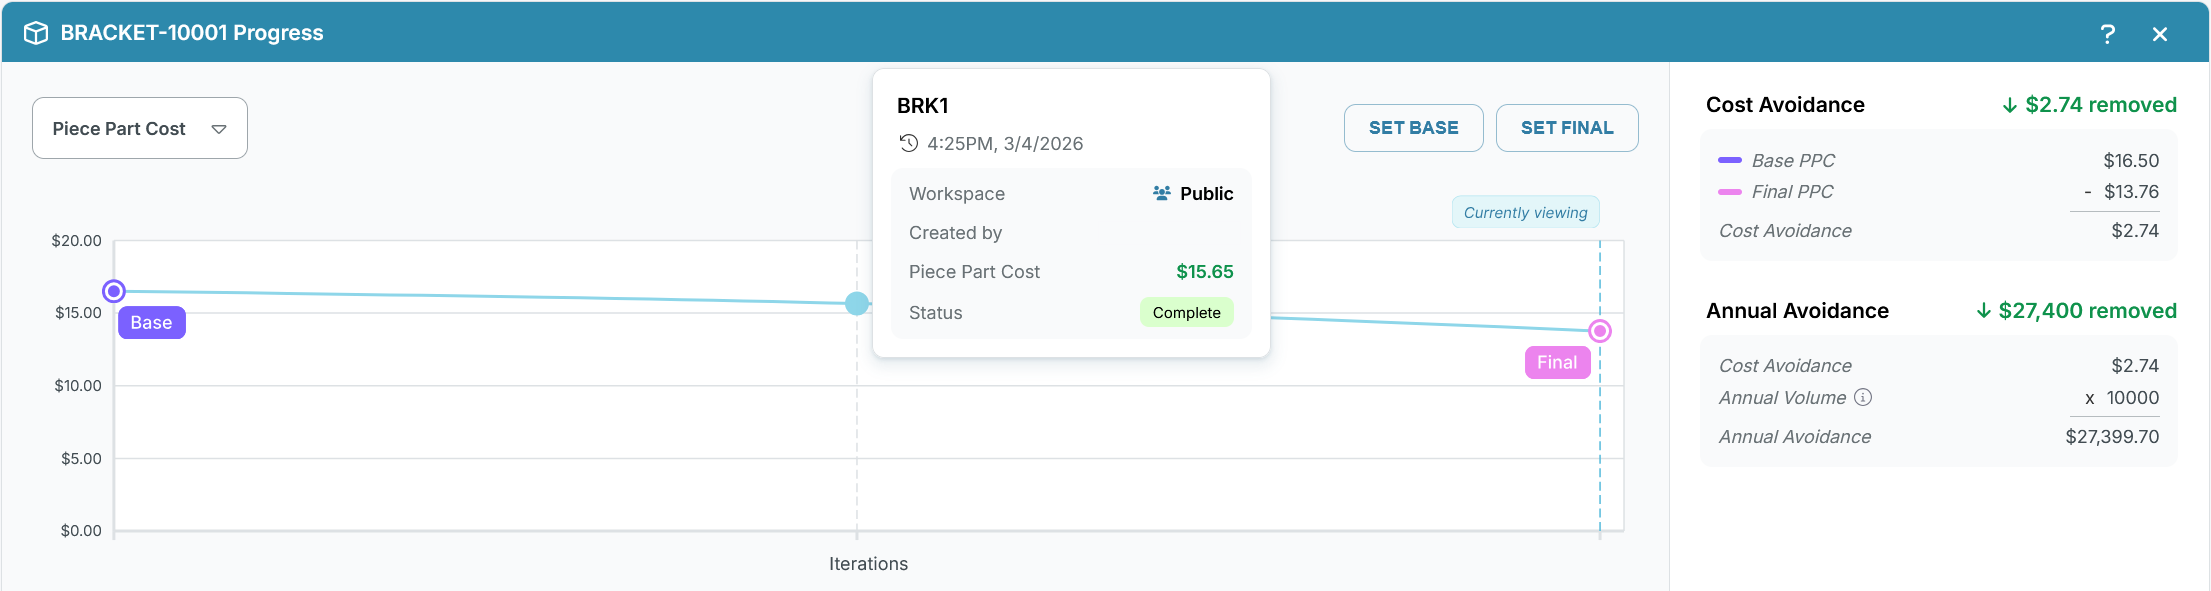
Once you've selected your Base and Final iterations, you'll see both:
- Cost Avoidance: The piece part cost (PPC) difference between the Base iteration and the Final iteration
- Annual Avoidance: The annualized cost difference (Cost Avoidance × annual volume)
Note
Results can show either a cost decrease (removed) or an increase (added)
Set a Base and Final Iteration
- Open a published scenario and successfully analyzed more than once
- In Evaluate, select PROGRESS to open the Progress drawer
- In the Progress drawer, select SET BASE
- Choose a data point on the chart, then select SAVE and SET BASE to confirm
- From the Progress drawer, select SET FINAL
- Choose a data point on the chart, then select SAVE and SET BASE to confirm
Tip
Hover over a point to see more information, select a point to see the basic and advanced inputs used