Workflow Generated Reports
aP Connect Workflows can generate reports and email them to members of your organization or write them to your PLM or File system. For information about the types of reports that aP Connect Workflows can generate, and DFM Risk Ratings, a key metric that is included in several types of reports, see:
- DFM Part Summary Report
- DTC Part Summary Report
- Part Cost Report
- Part Carbon Report
- DFM Multiple Parts Summary Report
- DFM Risk Rating
DFM Part Summary Report
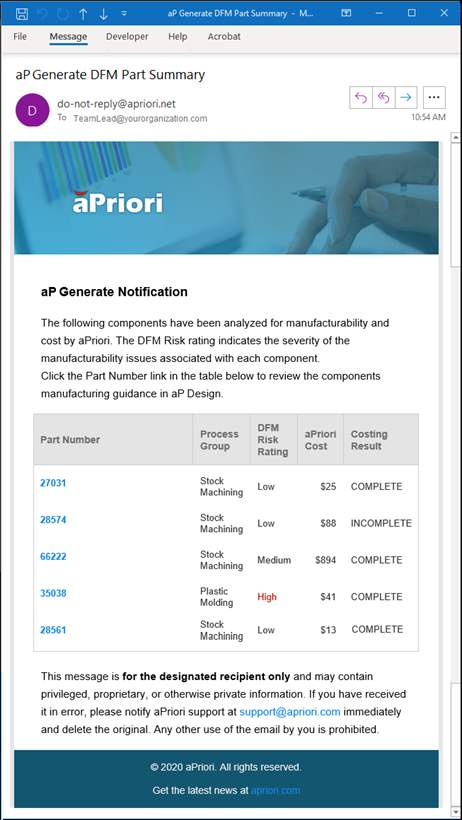
DFM Part Summaries are useful for communicating critical cost and design issues. A Workflow can generate and send a DFM Part Summary notification email to members of your team and to key stakeholders. For more information, see Workflow Notifications.
A DFM Part Summary contains the Part Number, Process Group, DFM Risk Rating, aPriori Cost, and Costing Result (whether the costing process was successful) for each component in the summary. Each Part Number in the DFM Part Summary is a link that an active aP Design user can click to open the scenario for the costed component to the aP Design Evaluate.
This figure shows an example of a DFM Part Summary notification email.
DTC Part Summary Report
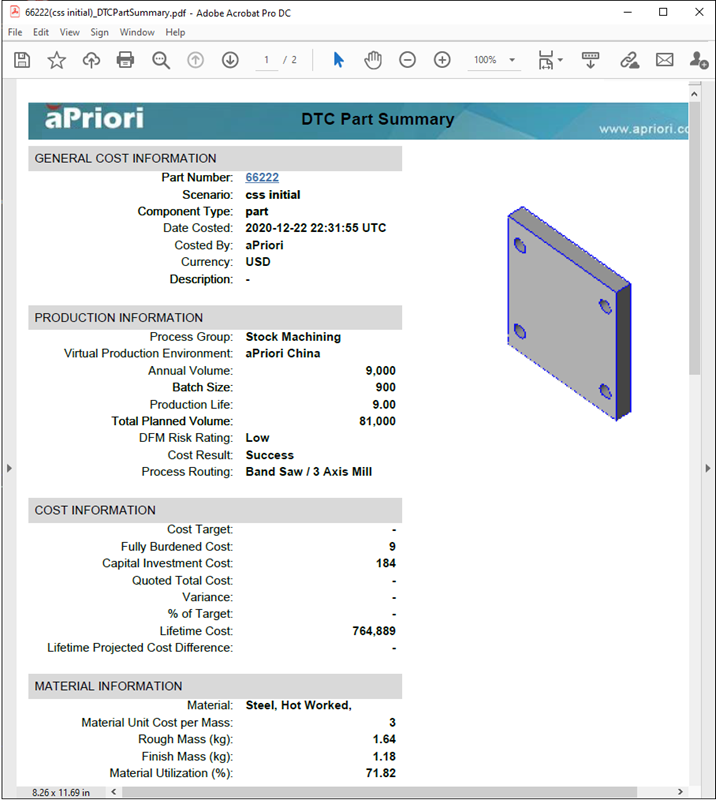
A DTC Part Summary report presents costing results, including design guidance, that suggest design changes that can improve manufacturability and lower cost.
If you configure a Workflow to generate and attach a DTC Part Summary report to an DFM Part Summary notification email, the Workflow generates and attaches a DTC Part Summary report for each component that meets the criteria defined by the Workflow Query Definitions for the Workflow and, as applicable, the Filter settings for the attached report. For more information, see Workflow Notifications.
You can also attach a DTC Part Summary report to your PLM or File System on a component-by-component basis for each component that meets the criteria defined by the Workflow Query Definitions for the Workflow and, as applicable, the Filter settings for the attached report. For more information, see Publish Workflow Results.
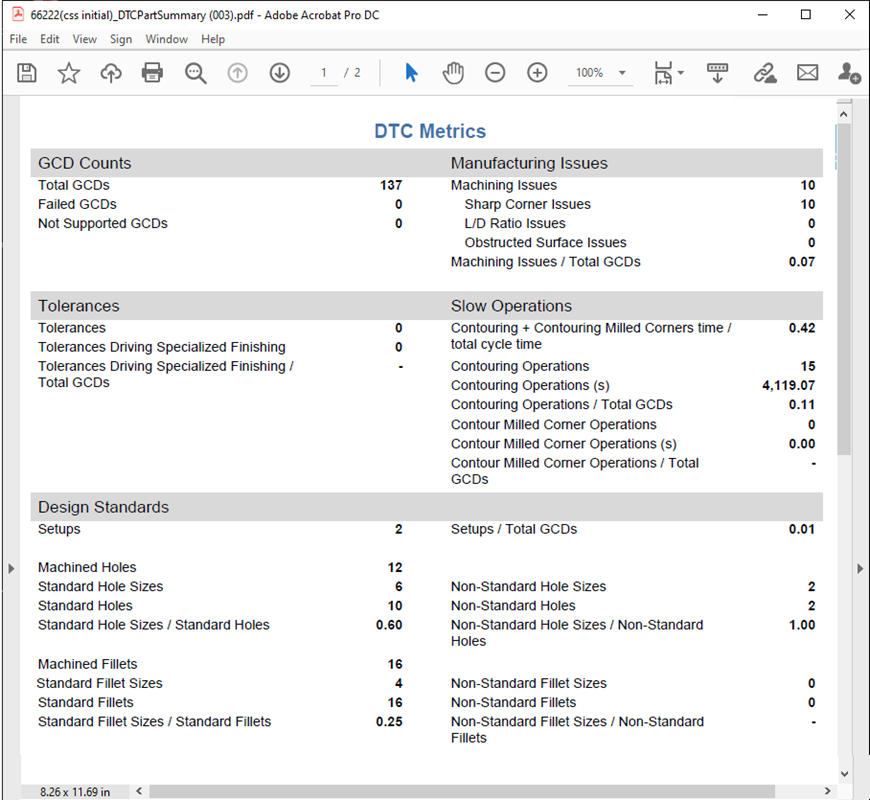
As these figures show, a DTC Part Summary report is a two-page pdf file that summarizes the inputs and outputs, including the DTC metrics, for a single component. The DTC metrics include GCD counts, manufacturing issues, tolerances, slow operations, and design standards.
Part Cost Report
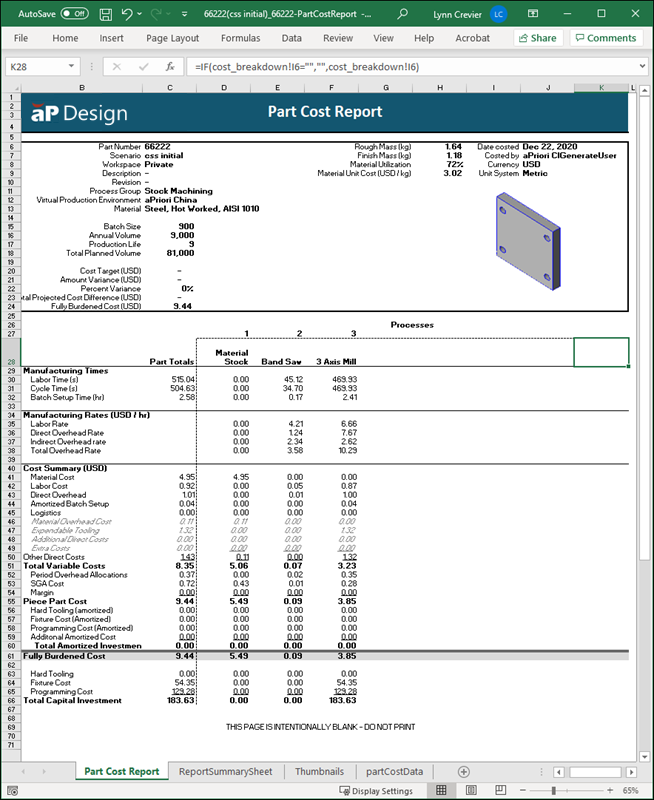
A Part Cost report is a spreadsheet report that contains the costing inputs and outputs for one component, including the manufacturing times, manufacturing rates, and costs for each process that is required to make the component. If you configure a Workflow to generate and send a DFM Part Summary email, you can also configure it to generate and attach a Part Cost report to the email. For more information, see Workflow Notifications. If a Workflows is configured to attach a Part Cost report, it generates and attaches one report for each component that meets the query definition for the Workflow and, as applicable, the filter for the report.
You can also attach a Part Cost report to your File System on a component-by-component basis for each component that meets the criteria defined by the Workflow Query Definitions for the Workflow and, as applicable, the Filter settings for the attached report. For more information, see Publish Workflow Results.
A Part Cost report spreadsheet contains these four worksheets:
- Part Cost Report
- ReportSummarySheet
- Thumbnails
- partCostData
This figure shows the Part Cost Report worksheet, which consolidates the data from the other three worksheets.
Note:
To view the data in the report, you may have to enable the spreadsheet for editing.
Part Carbon Report
The Part Carbon (CO2e) Report provides a comprehensive overview of the carbon footprint for materials and manufacturing of a part or component in your workflow. This report focuses on sustainability metrics and offers valuable insights into the environmental impact of your manufacturing processes.
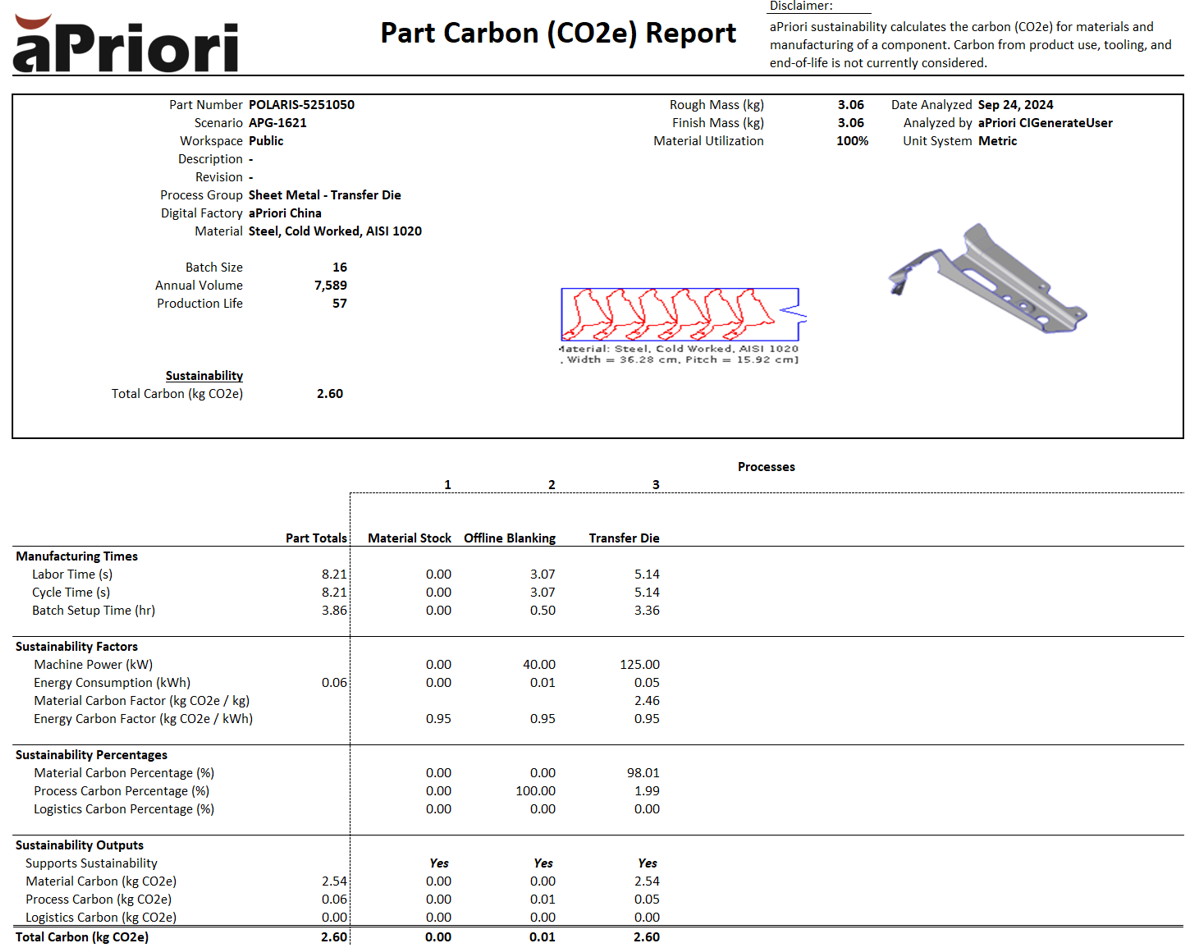
Sustainability Fields in the Part Carbon (CO2e) Report
-
Manufacturing Times
This section captures important time-based metrics, including:
- Labor Time (s): The amount of time required for labor processes.
- Cycle Time (s): The time taken for a single manufacturing cycle.
- Batch Setup Time (hr): The time required to set up equipment for batch production.
-
Sustainability Factors
Displays the key factors influencing the carbon output of the manufacturing process:
- Machine Power (kW): Power usage of the machines during production.
- Energy Consumption (kWh): Total energy consumed during the manufacturing process.
- Material Carbon Factor (kg CO2e / kg): The carbon emissions associated with the materials used.
- Energy Carbon Factor (kg CO2e / kWh): The emissions generated per unit of energy consumed, based on electricity usage.
-
Sustainability Percentages
Breaks down the carbon impact by process:
- Material Carbon Percentage (%): The percentage of total carbon emissions attributable to the materials used.
- Process Carbon Percentage (%): The manufacturing processes' emissions.
- Logistics Carbon Percentage (%): Emissions related to transportation and logistics.
-
Sustainability Outputs
Summarizes the key carbon emissions data for the part:
- Supports Sustainability: Indicates whether the process supports aPriori’s sustainability calculations (Yes, No, or Partial).
- Material Carbon (kg CO2e): The carbon emissions directly attributed to the materials used.
- Process Carbon (kg CO2e): Emissions generated from the processes used to manufacture the part.
- Logistics Carbon (kg CO2e): Emissions from the transportation of the part between facilities.
-
Total Carbon (kg CO2e)
The total CO2 emissions for the part are calculated by summing Material Carbon, Process Carbon, and Logistics Carbon. This value represents the part's overall environmental impact.
Note:
You can only use the Part Carbon Report if you have an active Sustainability License. If the workflow is invoked but you do not have an active Sustainability License, the workflow completes but the Part Carbon Report is not generated. This ensures minimal workflow disruption.
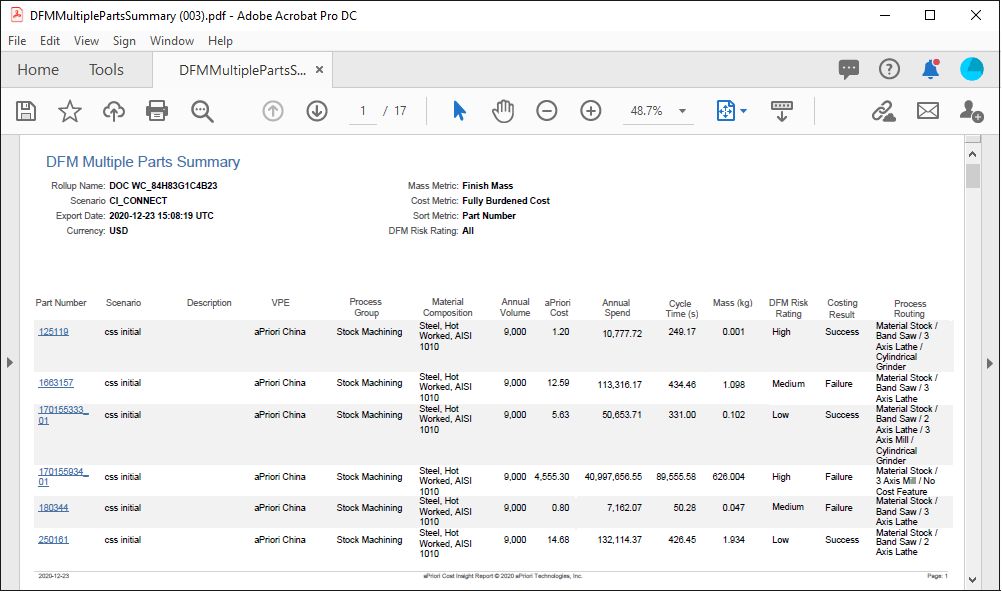
DFM Multiple Parts Summary Report
A DFM Multiple Parts Summary report summarizes the Design for Manufacture metrics for each part in the report. If you configure a Workflow to generate and send a DFM Part Summary email, you can also configure it to generate and attach a DFM Multiple Part Summary report to the email. For more information, see Workflow Notifications. If a Workflow is configured to generate and attach a DFM Multiple Parts Summary report to an email, the Workflow generates and attaches a single report that includes every component that meets the query definition of the Workflow and as applicable, the filter that is applied to the attached report.
As this figure shows, a DFM Multiple Parts Summary report contains the Part Number, Scenario Name, Description, Digital Factory, Process Group, Annual Volume, aPriori Cost, Annual Spend, Cycle Time, Mass, DFM Risk Rating, Costing Result, and Process Routing for multiple components.
DFM Risk Rating
A Design for Manufacture (DFM) Risk Rating is included in the DFM Part Summary, DTC Part Summary, and DFM Multiple Parts Summary for each component that uses a DTC-supported process groups. A DFM Risk Rating is a costing output for DTC supported process groups that indicates the severity of the manufacturing issues for the component. By default, the DFM risk rating is included in both the Email and PLM Report Attachment actions. You can also include the rating in the PLM Field Write action by writing the DFM risk rating back to part attributes in your PLM system or, for a File System integration, to the output spreadsheet.
During the costing process, aP Design extracts and analyzes the geometric features of the component that is being cost. Each geometric feature that requires a manufacturing step and, therefore, contributes to manufacturing costs, is categorized as a Geometric Cost Driver (GCD).
For process groups that are supported for DTC, aP Design also determines how many issues the design presents for the specified manufacturing process.
Note
Only these process groups are supported for DTC in aP Connect:
- Stock Machining
- Casting – Die
- Casting – Sand
- Plastic Molding
- Sheet Metal
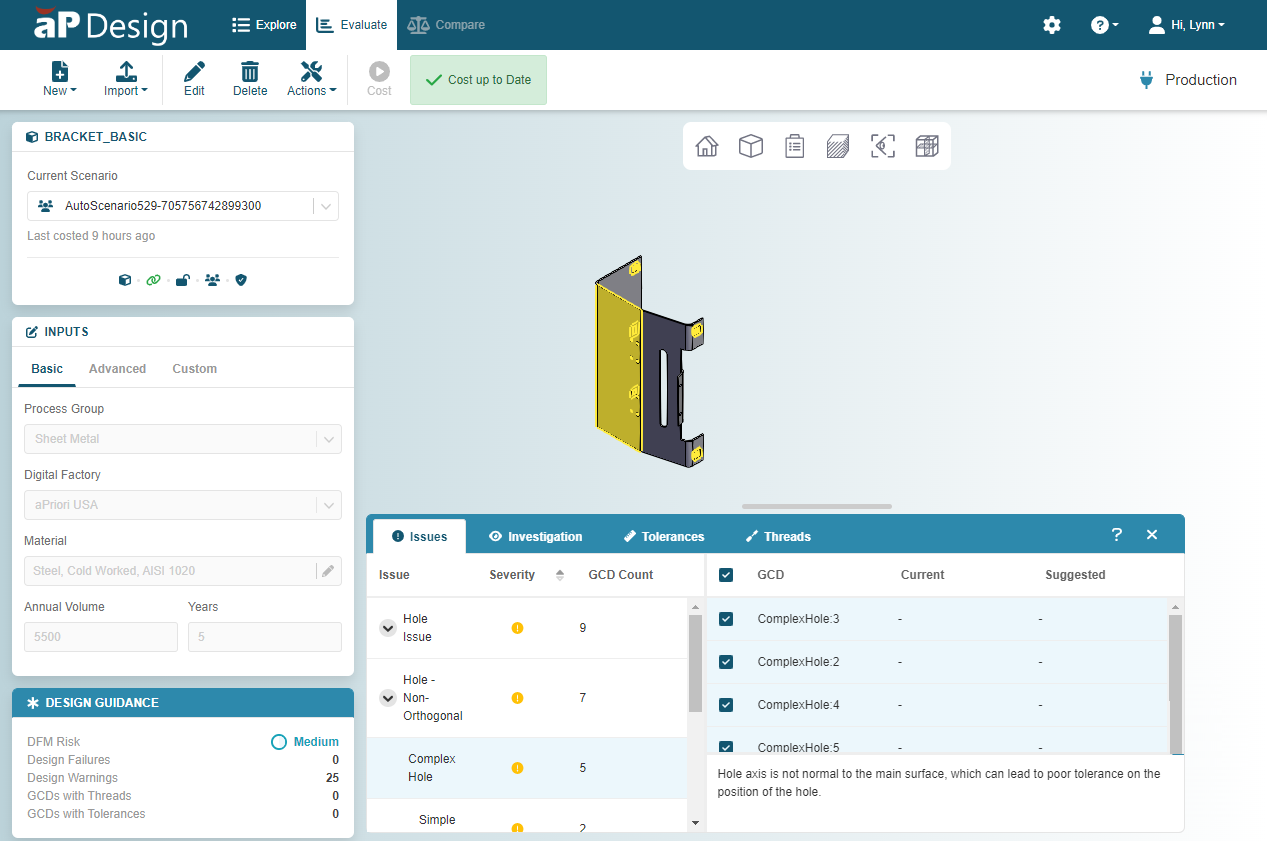
aP Design then uses the GCD and issue counts to calculate a DFM Risk Score. It also calculates a DFM Risk Rating that is based on the DFM Risk Score. The DFM Risk Rating indicates the severity of the manufacturing issues for the component.
As the figure shows, aP Design includes the DFM Risk Rating in the Design Guidance summary tile on the Evaluate page for each DTC supported costing. There are four different rating levels, Critical, High, Medium, and Low.
This table shows the types of issues that aP Design includes in the risk score calculation for each DTC supported process group.
| DTC Supported Process Group | Stock Machining |
Casting – Sand & Die | Plastic Molding | Sheet Metal |
|---|---|---|---|---|
| Contour milled corners operations | Y | – | – | – |
| Contouring operations | Y | – | – | – |
| Cores | – | Y | – | – |
| Failed GCDs | Y | Y | Y | Y |
| Grills | – | – | Y | – |
| Lifters | – | – | Y | |
| Machined GCDs | – | Y | – | Y |
| Process Group Specific Manufacturing issues* | Y | Y | Y | Y |
| Nonstandard fillet sizes | Y | Y | – | – |
| Nonstandard hole sizes | Y | Y | – | – |
| Ribs | – | – | Y | – |
| Setups with fewer than 5 GCDs | Y | – | – | – |
| Slides | – | Y | Y | – |
*Not including sharp edges on parting line for Casting process groups.
The DFM or DTC Risk Score, S, is calculated as
Where:
- N_issues is the number of issues
- N_GCDs is the number of GCDs
- S is the Risk Score
For any given component, the Risk Score:
- Cannot exceed 100.
- Equals 100 if the component contains any Not Supported GCDs.
There are two reasons for assigning a Risk Score of 100 to a component that contains Not Supported GCDs:
- aPriori cannot calculate an accurate Risk Score for a component if it cannot determine whether a geometric feature presents an issue.
- Unsupported features tend to coincide with incorrect modelling assumptions and substandard modelling practices, which in turn increase manufacturability risk.
Then, aP Design compares S, the DFM Risk Score, to thresholds that are normalized based on the complexity of the manufacturing process group. The table shows how the DFM Risk Rating for each process group is determined by comparing the DFM Risk Score to normalized thresholds for each DTC supported process group. The rating thresholds correspond to DFM Risk Score percentiles.
| DTC supported Process Group | DFM Risk Rating and Percentile | DFM Risk Rating and Percentile | DFM Risk Rating and Percentile | DFM Risk Rating and Percentile |
|---|---|---|---|---|
| Low | Medium | High | Critical | |
| 0-50th | 50th-75th | 75th-99th | 100th | |
| Sheet Metal | S < 10 | 10 ≤ S < 20 | 20 ≤ S < 100 | S =100 |
| Casting - Die | S < 25 | 25 ≤ S < 50 | 50 ≤ S < 100 | S =100 |
| Casting - Sand | S < 25 | 25 ≤ S < 50 | 50 ≤ S < 100 | S =100 |
| Plastic Molding | S < 35 | 35 ≤ S < 60 | 60 ≤ S< 100 | S =100 |
| Stock Machining | S < 7 | 7 ≤ S < 18 | 18 ≤ S < 100 | S =100 |