DTC Metrics Reports
aPriori aP Analytics provide access to Design to Cost metric data. For OOB (out of box) reports, this consists of a set of Machining DTC reports and a similar set of DTC reports for Sheet Metal. You can also use Use aP Analytics Ad Hoc Reports to create additional, custom reports around DTC metrics.
DTC Metrics Reports Basics
The DTC Metrics Reports for Casting, Plastics, Machining and Sheet Metal are similar. The examples below show the steps for generating a Machining Report. Where appropriate, differences for Sheet Metal Reports are noted.
DTC Metrics Reports provide a top-level graphical chart and three detailed sub-reports to help you identify parts that have significant DTC issues. This allows your company to address these issues and make potentially significant cost reductions.
Info
See Manufacturability Risk for a real-world example of using these reports.
Generating DTC Reports
Creating meaningful DTC reports:
-
In aP Pro, create a one-level deep roll-up of the target parts, for either machined parts or sheet metal parts. (See the notes below for more details.)
Note:
Currently the selected rollup should be the parent for included parts. The report for Rollup-1 from the example below will be empty, because there are no parts with parent = Rollup-1. Reports for Rollup-2 will contain Part-1 and Part-4.”
-
Use aP Admin Scenario Export to export that roll-up from the aPriori operational database to the aP Analytics reporting database. You can either create a special export set for this roll-up, or ensure that it gets included in an All or All Delta export.
Note:
If you have existing scenario export jobs that were executed prior to 2019 R1, you must make a change to the exported scenarios in aP Pro or aP Design, save the updated scenarios, and then re-export them. Otherwise they will not contain any DTC metrics to work with. If you do not change the scenarios in some way (e.g., recosting, or changing the description) and resave them, they will not be included in a re-export due to aPriori’s storage saving optimization.
-
Use aP Analytics to generate the Machining DTC OOB reports as described in this section.
Note:
In general, you should keep roll-ups very simple for DTC Reports: the roll-up should be one-level deep, otherwise your reports may miss parts that you expect to be included or may even be completely empty. Consider the following multi-level roll-up:
In this example:
- The report for Rollup-1 is empty.
- A report for Rollup-2 contains only Part-1 and Part-4.
- A report for Rollup-3 contains only Part-7.
General workflow for DTC Reports
You can use the various DTC Reports to focus in on progressively more detailed views of parts that are good candidates for cost savings. For example, you might:
- Generate a top-level DTC Report to get a general feel for large spend parts, parts with high DTC scores, outlier parts, etc.
- Drill down to the DTC Comparison Report to see how parts rank relative to each other.
- Drill down to the DTC Details Report to make a final selection of cost saving candidates (and perhaps generate a spreadsheet to forward to Design Engineers for part modifications).
- At any point, generate a DTC Part Summary report for details about a part.
How to Generate DTC reports
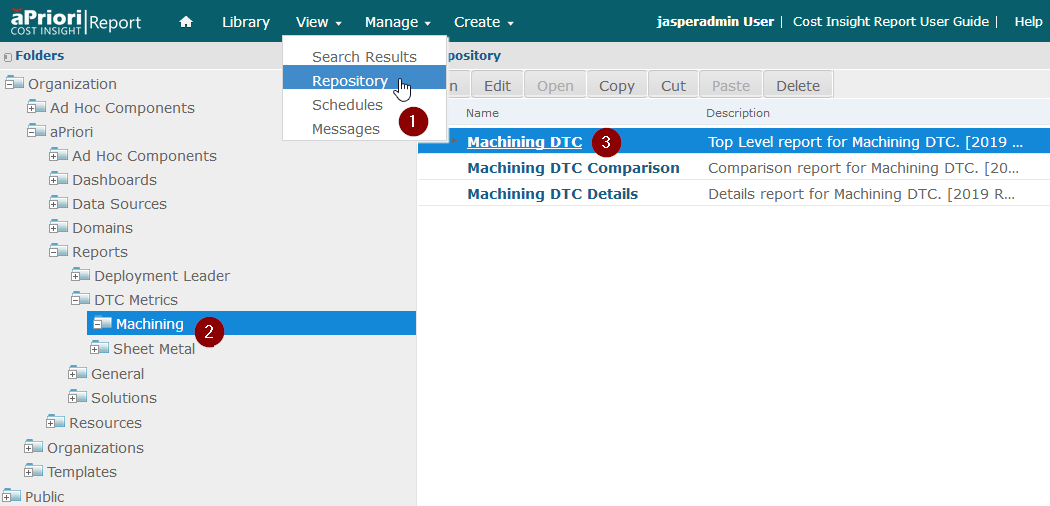
In aP Analytics, click Repository from the View menu.
-
Expand the Folders column and navigate to DTC Metrics Organization > aPriori > Reports > DTC Metrics
-
Select either one of these process group areas:
-
Casting
-
Machining
-
Plastic
-
Sheet Metal
Note:
DTC Reports include data for scenarios that use the Sheet Metal process group but do not include data for scenarios that use process groups for specific types of sheet metal manufacturing such as Sheet Metal-Hydroforming, Sheet Metal-Roll Forming, Sheet Metal-Stretch Forming, and Sheet Metal-Transfer Die.
-
-
In the right panel, click the top-level report (Casting DTC, Machining DTC, Plastic DTC, or Sheet Metal DTC). This example creates a Machining DTC Report.
-
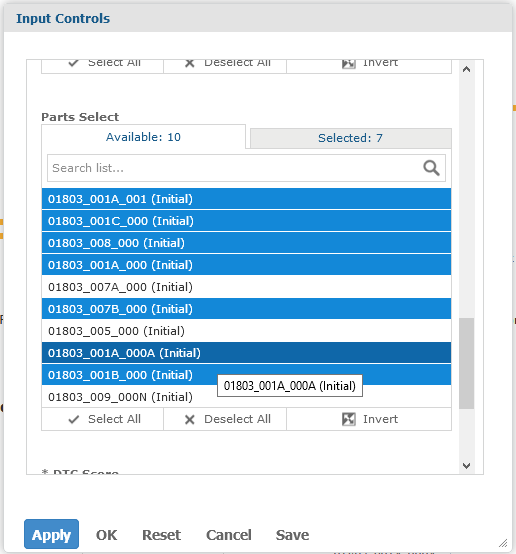
Fill out the Input Controls dialog to access the roll-up containing the parts. IMPORTANT: See the discussion at Using the Input Controls for DTC and Comparison Reports for more information about how to select the proper values in this dialog to achieve your desired results.
Field Description Use Latest Export? This setting controls which export sets within the specified date range will be used for the report, and whether all versions of the scenarios will be included, or just the latest version.
Choose from:
Scenario—(This is one of two “yes” responses.) This option specifies that the Export Set field below will be populated with every export set within the date range specified by the Earliest/Latest Export Date settings below. The contents of the All sets will not be merged with their subsequent All Delta exports. The report will use only the latest version of scenarios from the selected export sets. This is useful for generating reports from the latest scenarios from just specifically targeted export sets.
All—(This is the second of two “yes” responses.) This is similar to the Scenario option above, except the Export Set field will be populated with only All exports within the specified date range, merged with any of their subsequent All Delta exports. The report will use only the latest version of scenarios from the selected export sets. This is useful for generating reports from all of the latest scenarios.
No—The Export Set field will be populated with all export sets within the specified date range, and All and All Delta exports will NOT be merged. The report will use all versions of all scenarios within the selected export sets. This setting is useful when analyzing trends across time.Earliest/Latest Export Date Narrow down the time range of the Export Sets you want included in the report. Export Set This field is populated based on the settings of the Use Latest Export?and Earliest/Latest Export Date as described above. Select the Export Sets you wish to use for your report. Rollup Use the drop-down menu to select the rollup you wish to use from those available from the Export Set(s) specified in the previous fields. Cost Metric This determines the Y-axis of the top-level DTC report chart.
Select from:
Fully Burdened Cost
Piece Part Cost.Mass Metric This determines the X-axis of the top-level DTC report chart.
Select from:
Finish Mass
Rough MassSort Order This field controls the way that parts are listed in the Comparison and Details sub-reports. The options displayed here will differ depending on which process group for which you are creating the DTC Report.
Note that this setting has no effect in the top-level report.Currency Code Select the Currency the report will use to display the results. (aPriori uses currency abbreviations per the ISO 4217 standard.) Minimum Annual Spend Annual spend is:
(annual volume * fully burdened cost) OR
(annual volume * piece part cost)
You can filter machined parts in the Machining DTC report by specifying only parts that exceed a specified threshold.
For example, you might be able to ignore parts with lower annual spend since they don’t offer as much opportunity for cost savings. Even a low-cost part might offer substantial cost savings if the annual volume is very large.Process Group The options displayed here depend on the type of DTC Report you are generating. For example, Sheet Metal allows only Sheet Metal to be selected, but Machining allows you to filter in parts from either Stock Machining or 2-Model Machining. Note: If a part in a process group that is not supported for DTC, such as Forging, has machining details, they will not appear in the Machining DTC report. DTC Score “DTC score” is an internally calculated value based on DTC metrics applicable to the process group. For Machining, the score is based on manufacturing issues, tolerances, ineffective cycle times, and non-standard tools. For Sheet Metal, the score is based on manufacturing issues, bends, machining time, and tolerances.
The actual internal numeric value is never displayed; rather it is used to divide parts within a set into relative categories: low, medium, high, where high DTC score parts probably offer more opportunity for cost savings than lower ranked parts in the same group. A part with a high DTC score in one set might have a relatively low DTC score in another set with different parts. By specifying only high, or high and medium, in this field, you can simplify and declutter the report by not displaying low DTC parts. In the top-level report chart, high DTC parts are displayed in purple, medium are displayed in orange, and low are displayed in light blue.
Note: While DTC scores are never displayed, a DTC Rank based on these scores is shown the DTC Details reports. You could, for example, have two different parts within a report with a “Medium” DTC score, but one part’s ranking might be 5 while the other’s is 6, indicating that the 6 might have a higher priority than the 5 for evaluation.Outlier Distance Sets the distance the outlier lines are drawn away from the average cost per mass trend line. The distance units are in standard deviations. Select Parts Select and/or deselect the items in this field to control which parts appear in the reports. Use the Invert button to reverse the selection status of the items.
Note that changing the setting of the Sort Order field above immediately changes the order of the items in the Select Parts field. -
When you have filled out all the fields, click OK to display the top-level report.
DTC Report Information Structure
Top level DTC report
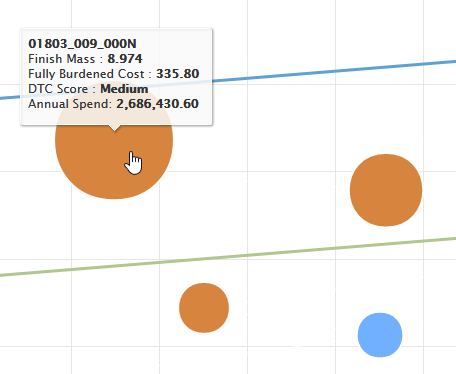
The top-level DTC report plots the parts on a chart showing cost (piece part or fully burdened) and mass (raw or finished):
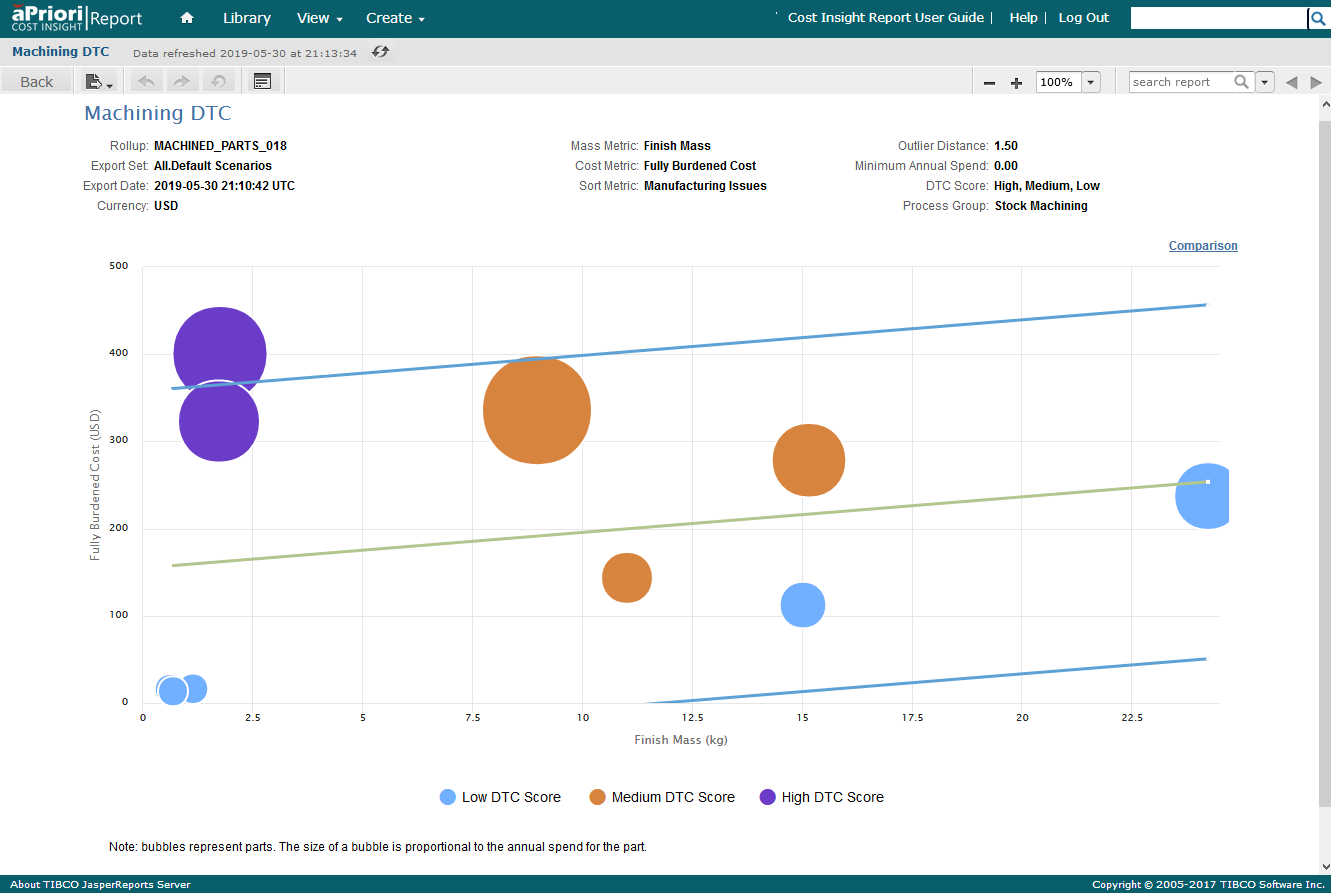
Purple parts have high DTC scores relative to the other parts and are the most likely targets to examine for cost savings. Brown and turquoise parts have relatively medium and low DTC scores, respectively.
Parts above the upper blue line are outliers (as defined by the Outlier Distance setting) and should be examined. Any part above the mean is above average; the outlier lines are there to convey the relative significance of the distances from the mean.
Larger circles indicate parts with higher annual spend. In many cases concentrating on a large brown circle, rather than a small purple circle, might yield more cost savings.
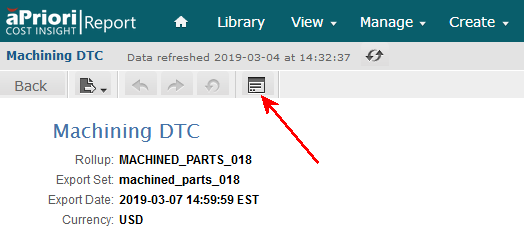
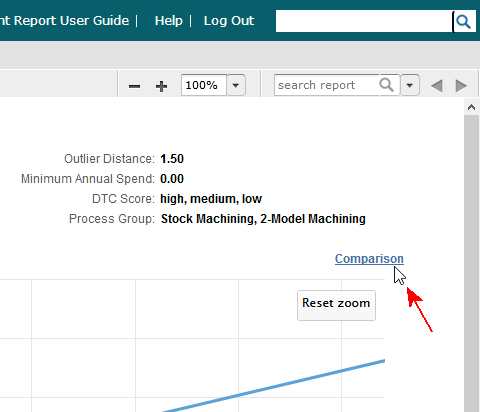
To fine-tune this view, clicking the Options button in the tool bar and modify the Input Controls settings.
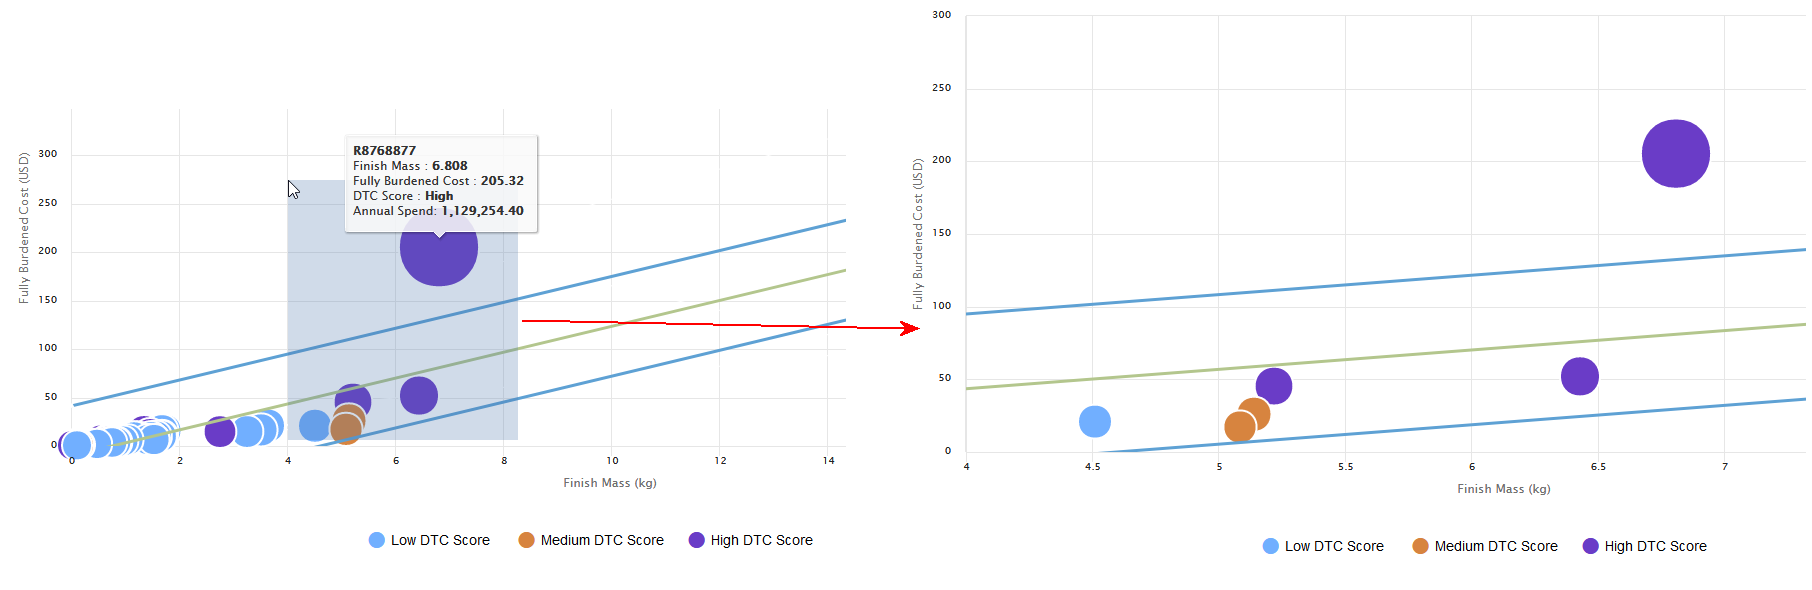
To focus on a highly populated area of the chart, you can click and drag a selection area to zoom in:
Note:
Your first click needs to be within the chart, not out in the axis labels.
Click the Reset Zoom button in the upper-right corner to restore the original view.
To get more information about a specific part, you can mouse over its circle to display a detailed tool tip.
Click the part’s circle to display a DTC Part Summary Report (see DTC Part Summary Report).
Comparison DTC sub-report
Click the Comparison link in the upper-right corner of the top-level chart to drill-down to the Comparison sub-report.
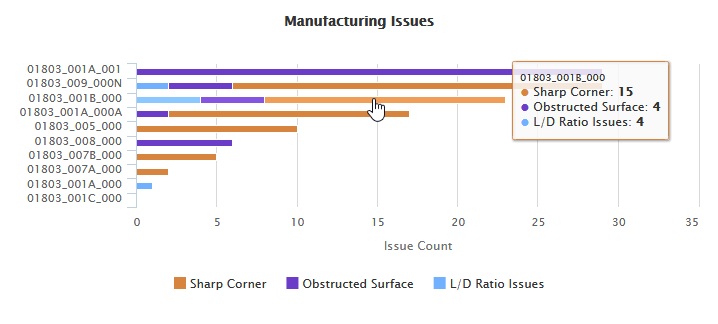
Use the Comparison Report to further refine your selection of parts to address by seeing where they rank relative to each other in key metric areas specific to the process group (these areas are summarized at the end of this section.
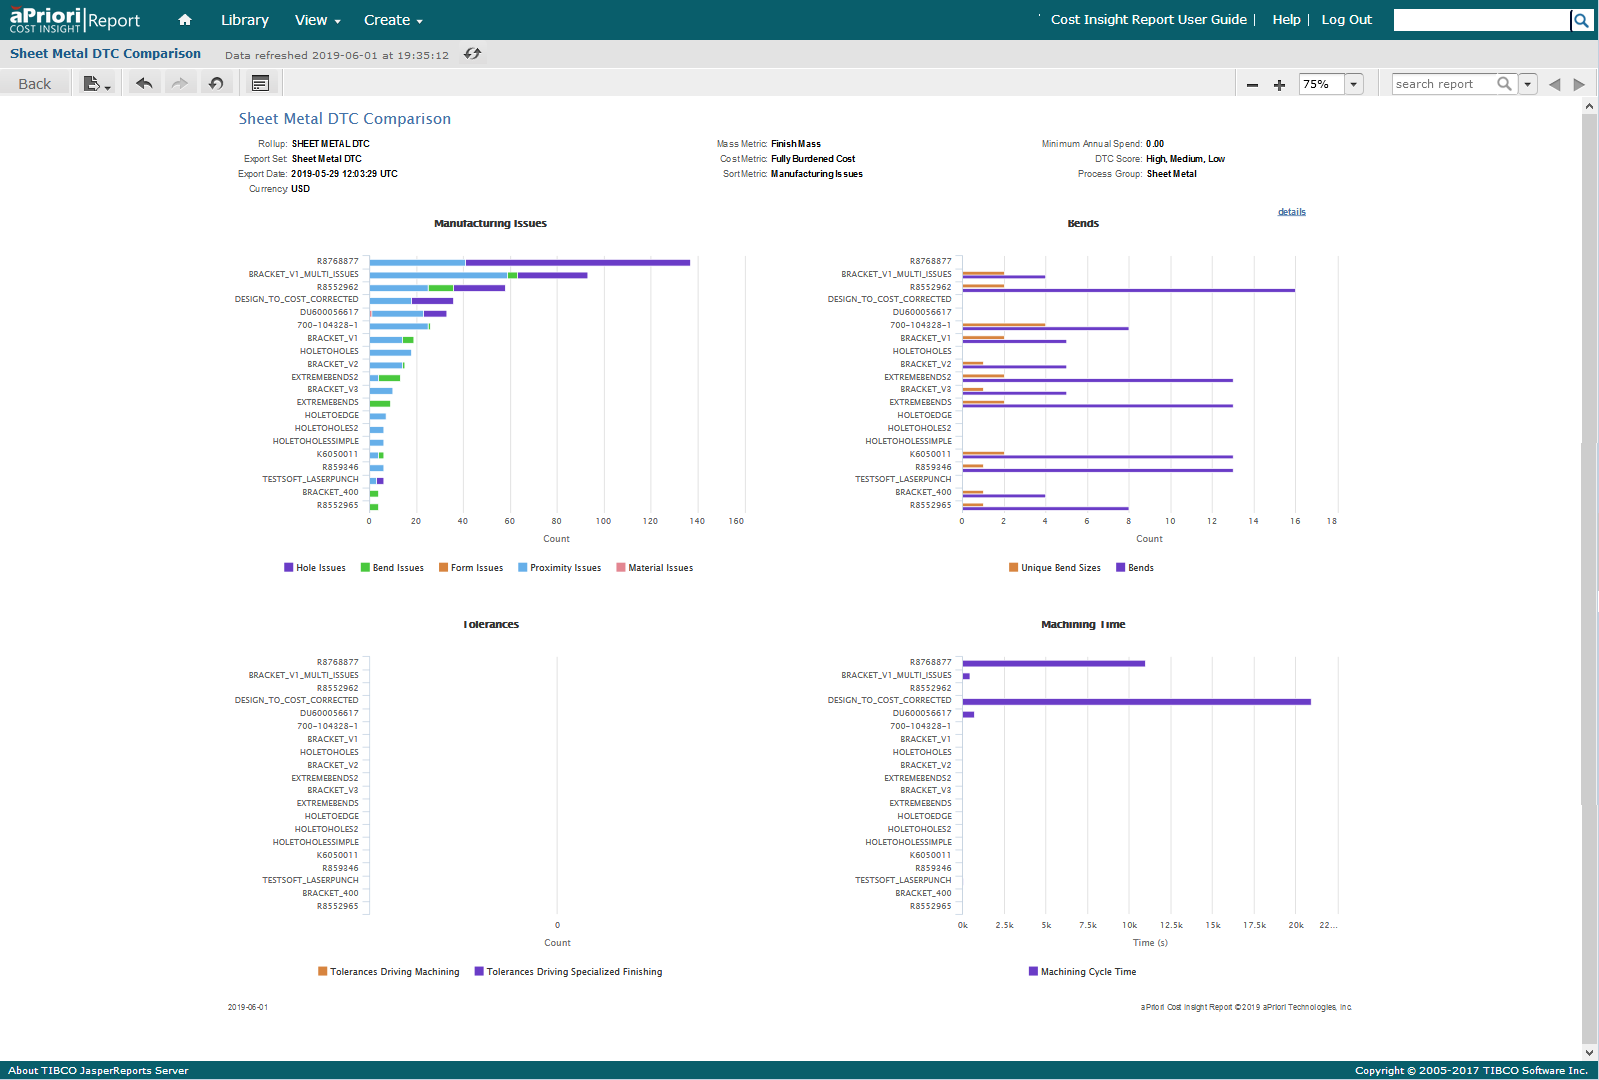
The examples below show Machining and Sheet Metal DTC Comparison Reports. They look similar, but each includes metrics that are specific to the process group.
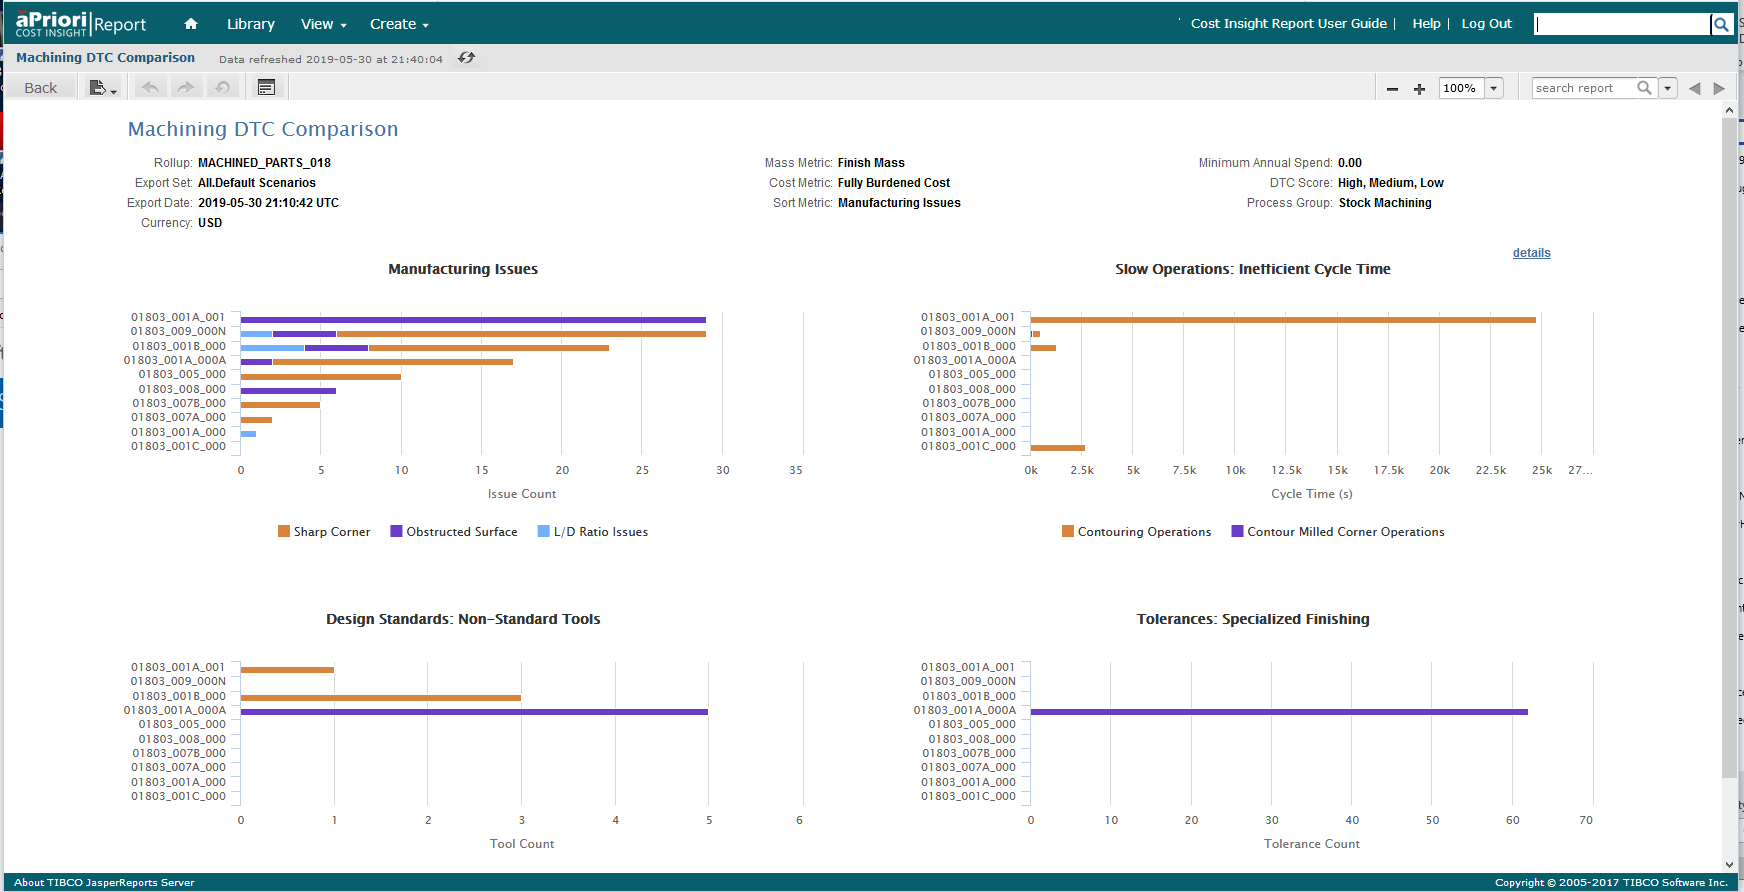
Hovering over the bars in the charts displays detailed tooltips that show the number of instances of each issue.
To display a DTC Part Summary Report, for any part in the report, click the bar for that part. For more information, see DTC Part Summary Report.
You can use the Options button to tweak your settings and fine-tune the display of the comparison chart. The fields available on the Input Controls dialog vary slightly depending on what report you are displaying. For example, when you are displaying the Comparison sub-report, the dialog displays a Parts field that allows you to enable and disable the display of specific part.
Note:
While you can extend your selections with Shift-Click, Ctrl-Click does nothing – simply click individual items to toggle them on and off.
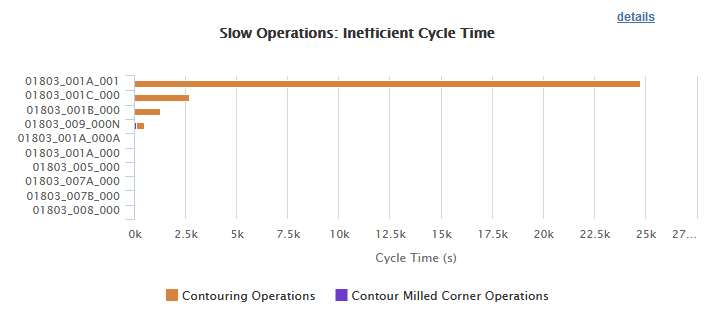
You can also change the Sort Order field to determine which sub-chart has its contents ordered by DTC issues. In the view above, the Manufacturing Issues chart shows the parts from least to most DTC issues. By changing the setting to Slow Operations, that chart will be re-ordered:
Process Group specific DTC Metrics
Machining-specific DTC Metrics
Some of the DTC metrics that apply to the Stock Machining and 2-Model Machining Process Groups are:
GCD Counts (Number of and Design for Manufacturing, DFM, statistics for Geometric Cost Drivers, GCDs)
- Total GCDs – Count of all feature level GCDs on the part; GCDs such as setup, parting line, draw direction, blank, perimeter, etc. do not contribute to this count
- Failed GCDs – Count of GCDs on the part that did not have a feasible manufacturing operation
- Not Supported GCDs – Count of GCDs where aPriori could not sufficiently recognize the geometry and break down into meaningful GCDs for the process group
- DFM Risk Score – Count of issues divided by the number of GCDs on the part. Used to calculate the Risk Rating. Values range from 0 to 100. A part with Not Supported GCDs is automatically given a score of 100.
- DFM Risk Rating – Indicates the severity of the manufacturing issues associated with a part. Values include 1 through 4, where Low = 1, Medium = 2, High = 3, Critical = 4.
Manufacturing Issues:
- Machining Issues – Count of GCDs which cannot be machined with standard cylindrical milling tools or turning tools for the selected routing and setups
- Sharp corner Issues: Sharp internal corners cannot be machined with a cylindrical end mill. A more expensive process such as EDM (electrical discharge machining) is required. Unless the part’s function requires such a sharp corner, it is advisable to fillet sharp corners. This enables standard end mills to machine the entire surface. If possible, choose a large fillet radius as this enables the use of larger, faster tools. Avoid choosing overly-small fillet radius as this will restrict the tool diameter, increase machining cycle time and cost, and possibly cause excessive tool length-to-diameter issues.
- L/D Ratio Issues:
Side Milling is a surface finishing operation in which the tool is moved laterally across the surface and material is removed by cutting teeth on the sides of the tool. If the ratio of the tool length (L) to the tool diameter (D) is too high, the tool will deflect and resulting surface quality will be poor. Typically, the maximum advisable Side Milling L/D ratio is about 8 although this threshold can vary based on factors such as material hardness and machineability, cutting speeds, and feed rates. aP Analytics displays a Side Milling L/D Ratio issue if it determines that the surface would be side-milled with a tool which exceeds the threshold.
To determine the size of a side-milling tool required for a surface, aPriori considers both the height of the surface and the radius of any concave fillets (corner radii) adjacent to the surface. The tool diameter must be slightly smaller than twice the fillet radius to side-mill the entirety of the surface and the adjacent fillet. Moreover, if the surface is part of a chain of surfaces which are all side milled, the smallest concave radius in the chain determines the tool diameter for all surfaces in the chain.
To address Side Milling L/D issues, open the part inaP Pro and consider the following actions:
- Modify the part geometry, increasing the radius of adjacent fillets to enable use of a larger-diameter tool.
- If you are confident the surface IS in fact side milled in production, you can override the side milling feasibility rules for the surface, effectively ignoring the L/D ratio for that surface.
- Use the process setup option Specify Maximum Side Milling Length to Diameter ratio to increase the allowable ratio for any surface on the part to match your in-house or supply-base practices. To access this option, right-click on the Machining node in the manufacturing process pane and select Process Setup Options
- Obstructed Surface: An obstructed surface is blocked by other geometry of the part, such that it cannot be finish-machined in entirety by conventional end mills, on the chosen routing/CNC machine and chosen setups. Note that some geometry that is obstructed for conventional milling tools can be made by other specialized cutters such as t-slot cutters or dovetail mills. Some actions you can take to address Obstructed Surface issues:
- Determine if the geometry could be made by other specialized cutters and if so, manually assign a similar operation such as Undercut Milling or Mill Grooving. For more information about these manual machining operations, refer to the aPriori Cost Modeling Guide or User Guide.
- Modify the part geometry, to eliminate the obstruction and allow the surface to be machined from existing setups.
- For example, the interior walls of the part might be obstructed by an overhanging rim. However, if the overhang is not large, the walls could be accessed with a t-slot cutter. In this case, manually assign the Undercut Milling operation to generate cycle time and cost estimates for the obstructed walls.
Tolerances (Specialized finishing)
Specialized finishing processes will be added to the routing when a GCD has a tolerance or surface roughness requirement that is too small (tight) for a typical milling or turning operation to achieve, increasing part cycle time and cost. Consider whether required tolerance or surface roughness values can be relaxed to enable making the part without these specialized finishing processes.
Open the part in aP Pro or aP Design, identify the GCDs with special finishing operations and their current tolerance and roughness values. Determine the smallest tolerance and roughness values that can be achieved by the primary milling or turning process. If you can increase the tolerance or roughness requirements to be greater than this Basic Machining Limit value, then the special finishing process no longer will be added for that GCD.
Slow operations (Operations that have inefficient cycle time)
The Slow Operations pane displays counts of surfaces which must be finished using ball-end mills. Finish-machining with a ball end mill involves making many small parallel passes over the surface with a low step-over to get a good quality surface. Therefore, Operations that use a ball end mill are slow relative to other faster finishing operations such as Facing or Side Milling. In some cases, the design of the part can be modified to eliminate the need for ball end milling. It may be practical to make such changes for surfaces with large cycle times.
- Contouring operations -- Contoured Surfaces is the count of surface GCDs assigned the Contouring finish machining operation. These surfaces are angled with respect to any of the active setup orientations, so cannot be finished by a faster operation such as Facing or Side Milling. If the cycle time and cost for finishing this surface is high, modify the design to eliminate the angle or alternatively, consider if another setup should be used to enable Facing or Side Milling.
- Contour Milled Corner Operations -- Contour Milled Corners is the count of PlanarFace GCDs which have one or more sharp corners that must be machined with a ball end mill, even though the majority of the surface can be finished by Facing. The Facing tool is too large to reach into the sharp corner.
This sharp corner condition occurs when the PlanarFace is adjacent to a fillet which turns a tight corner and creates a spherical surface. If the design can be modified so that the spherical region is eliminated, this will eliminate the need to contour-mill the corner of the PlanarFace. It is recommended to enlarge the corner radius that the fillet sweeps around, so that a larger Facing tool can reach into the entire corner.
Design Standards (GCDs that require non-standard tools)
It is recommended to minimize the number of non-standard tool sizes required to machine the part, since GCDs that require non-standard tool sizes require custom tool sizes to be purchased or special machining operations to be used.
Whenever this value is > 0, aPriori recommends opening the part in aP Pro, identifying the GCDs that require non-standard tools, and redesign if possible to use standard tool sizes.
- Non-Standard Fillet Sizes -- The count of fillets that do not use standard tool sizes.
- Non-Standard Hole Sizes -- The count of holes that do not use standard tool sizes.
For a complete list of Machining DTC Metrics that are supported for reports, see the aP Analytics User Guide.
Casting-specific DTC Metrics
The DTC metrics that apply to the Casting-Die and Casting-Sand Process groups are:
- GCD Counts
- Manufacturing Issues
- Tooling
- Machining
- Tolerances
- Slow Operations
- Design Standards
For a complete list of Casting DTC Metrics that are supported for reports, see the aP Analytics User Guide.
Plastic-specific DTC Metrics
The DTC metrics that apply to the Plastic Molding Process Group are:
- GCD Counts
- Manufacturing Issues
- Tooling
For a complete list of the Plastic DTC Metrics that are supported for reports, see the aP Analytics User Guide.
Sheet Metal-specific DTC Metrics
The types of DTC metrics that apply to the Sheet Metal process group are:
- GCD Counts
- Manufacturing Issues
- Machining
- Tolerances
- Design Standards
For a complete list of the Sheet Metal DTC Metrics that are supported for reports, see the aP Analytics User Guide.
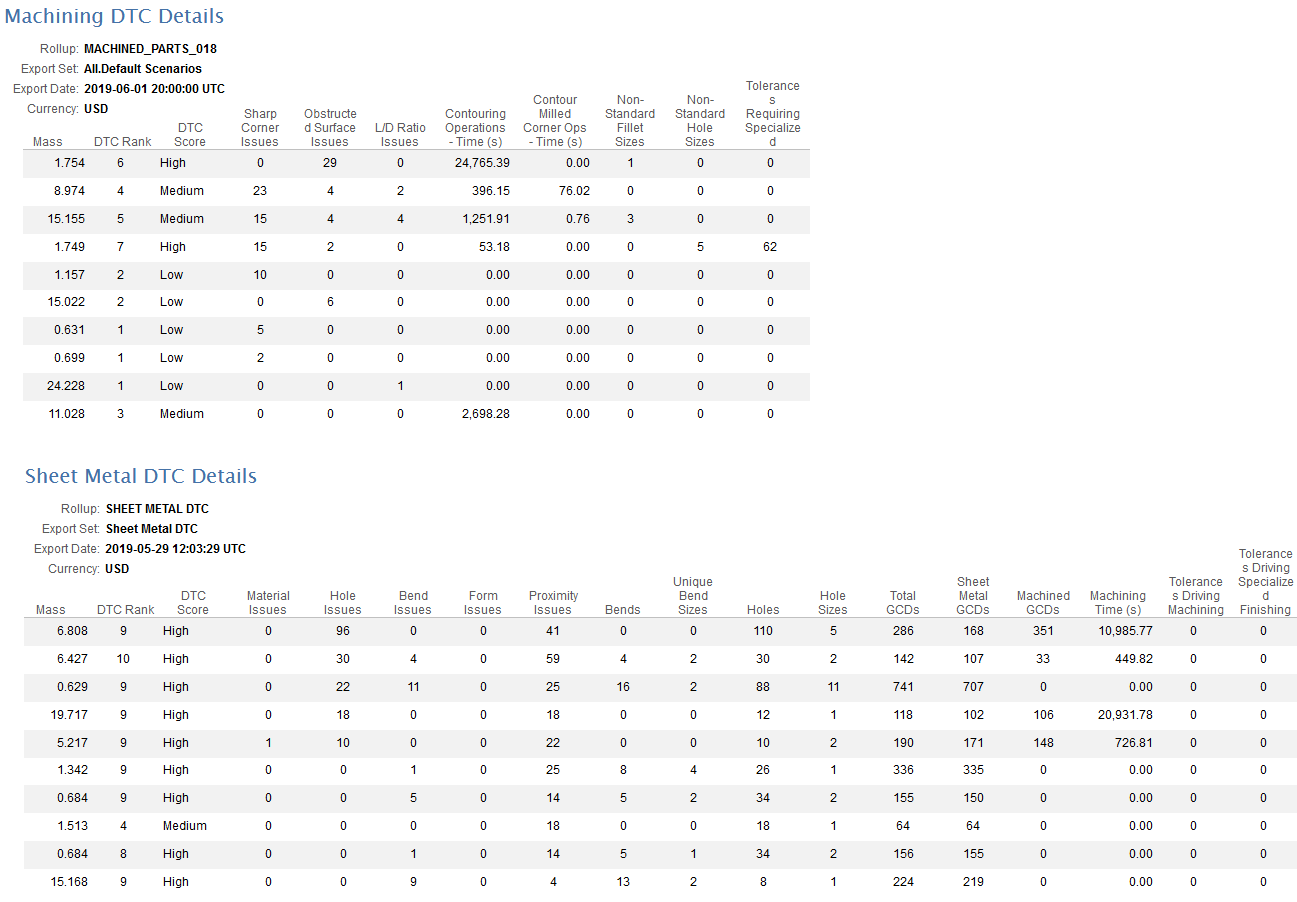
Details DTC sub-report
Click the Details link in the upper-right corner of the Comparison chart to drill-down to the Details sub-report. The purpose of this report is to do a final selection of parts and perhaps export them to an Excel spreadsheet. This would be sent to design engineers who work on redesigning the top set of parts with more potential for cost savings.
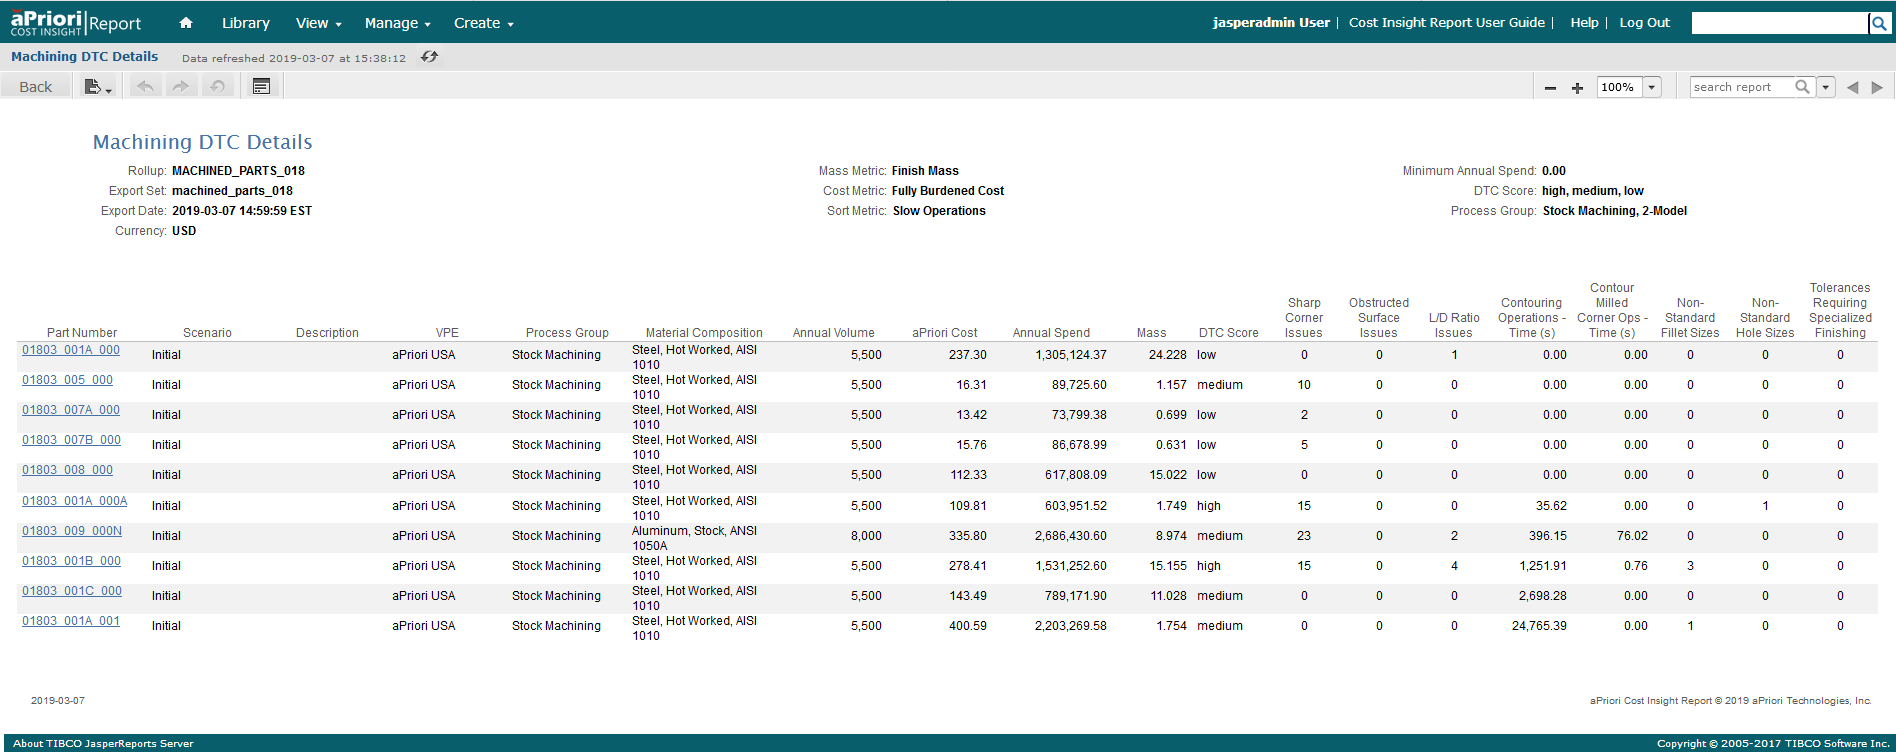
This provides tabular information about the parts, with basic info on the left, and DTC-specific info presented in the far-right columns. (The following examples show both Machining and Sheet Metal DTC columns on the right side of the reports.)
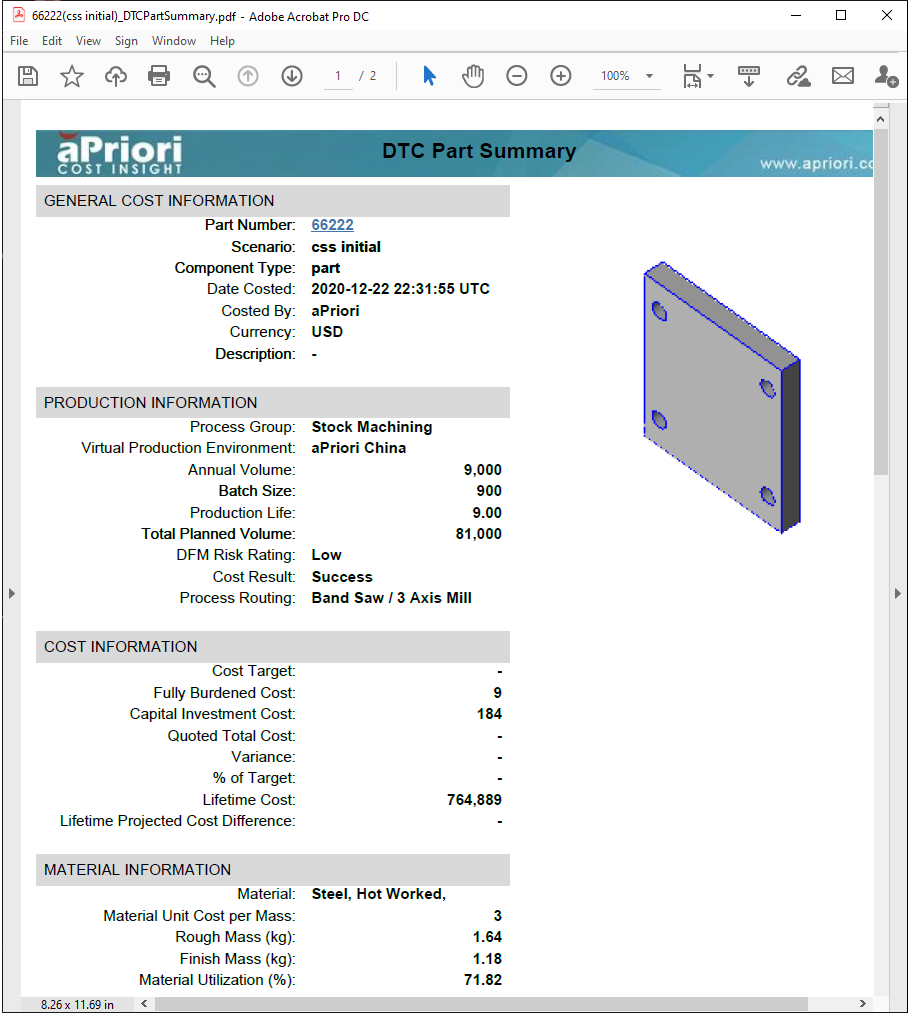
DTC Part Summary Report
A DTC Part Summary report is a two-page pdf that summarizes the inputs and outputs, including the DTC metrics, for a single component. The DTC metrics include GCD counts, manufacturing issues, tolerances, slow operations, and design standards. A DTC Summary Report can also contain design guidance that suggests changes that can improve manufacturability and lower cost.
As this figure shows, the first page of the report is similar to the first page of the Component Cost Report (see Component Cost Reports).
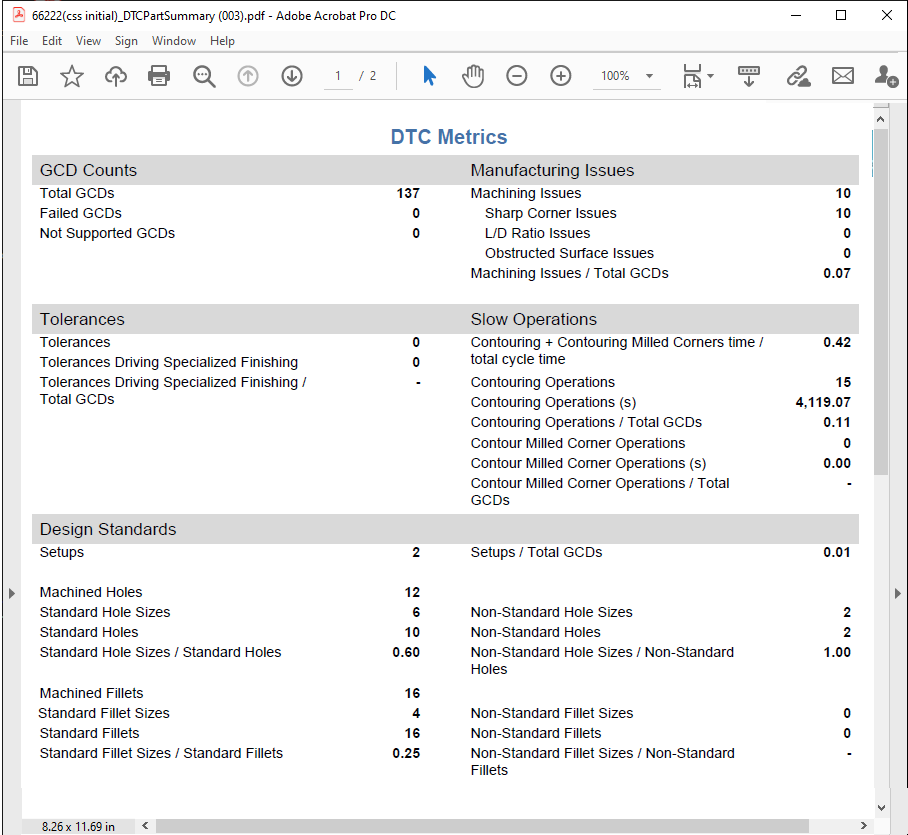
The second page of the report focuses on DTC metric information. This figure shows the DTC metrics for a part that uses the Machining Process Group.
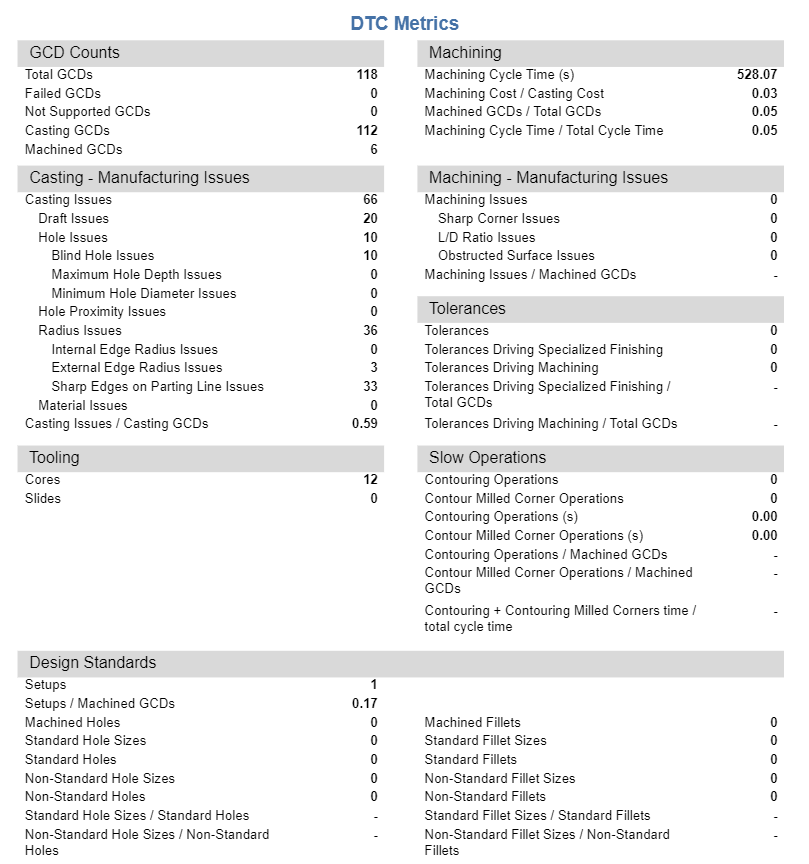
As this figure, which shows the second page of a DTC Part Summary report for a scenario that uses the Casting Process, shows, the type of DTC Metrics that appear in a DTC Part Summary report depend on the Process Group that is used to make the component.
To generate a DTC Part Summary report, use one of the following methods.
- Click a part circle in the top-level DTC Report.
- Click a bar in the DTC Comparison Report.
- Click a part name link in the DTC Detail Report.
- Click the DTC Part Summary report under the repository at Organization > aPriori > Reports > DTC Metrics.