Create Dashboards
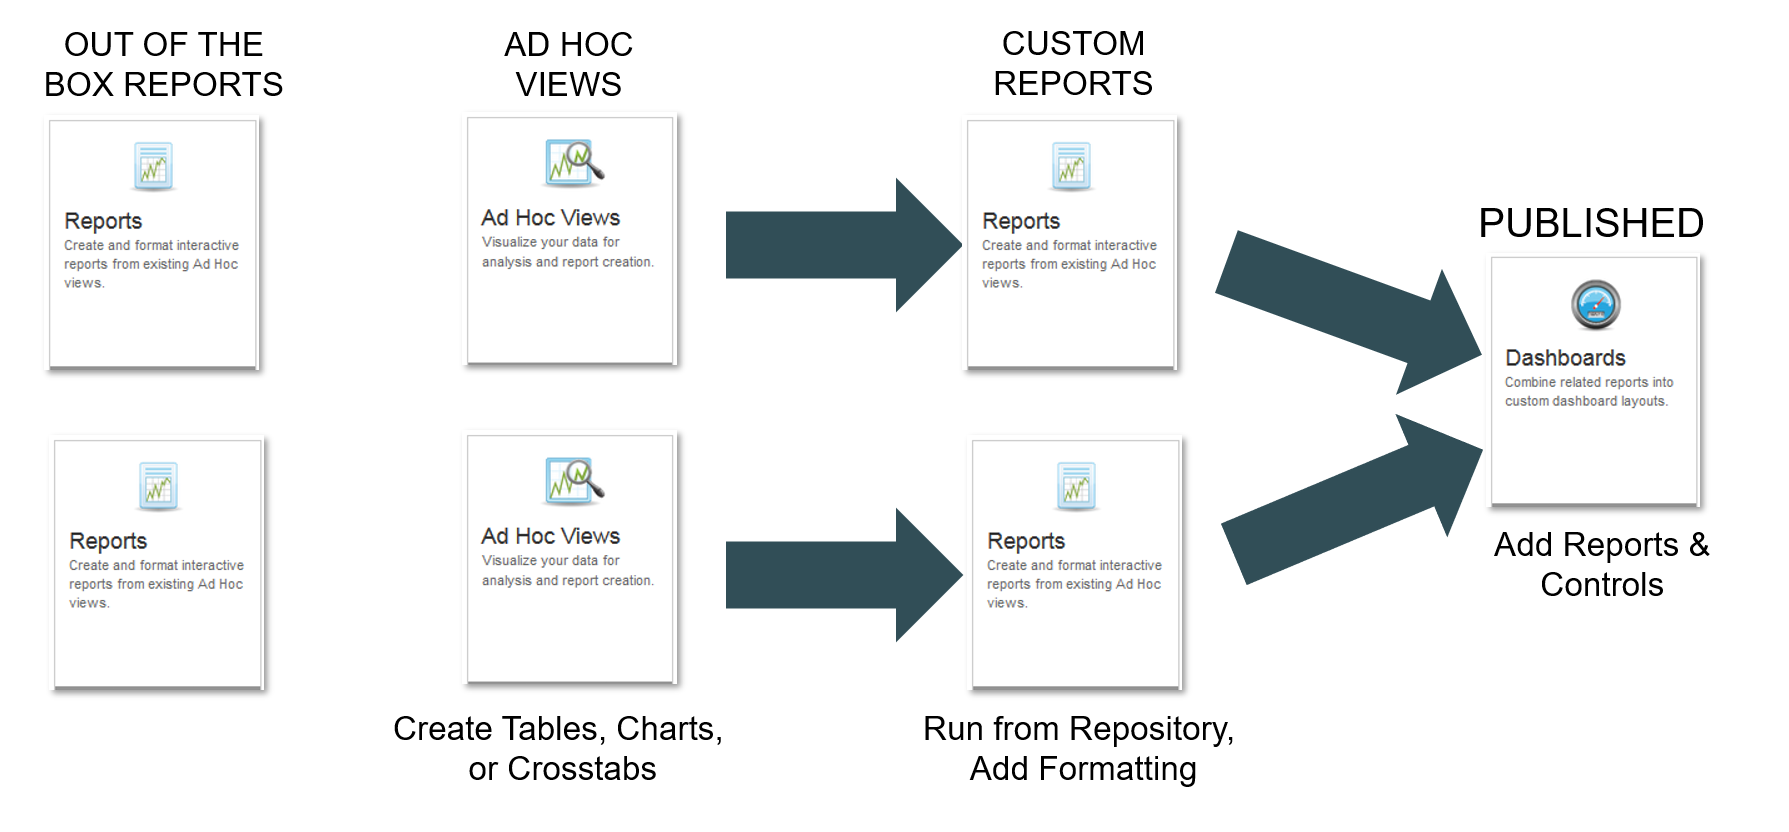
You can create and run dashboards to display several reports and Ad Hoc Views in a single integrated view, as well as being able to create new content that can include text, images and links to web pages.
Info
Each of these items when added are referred to as a dashlet.
Dashboards can combine all this existing content as well as any new content, but with the added functionality of a centralized control.
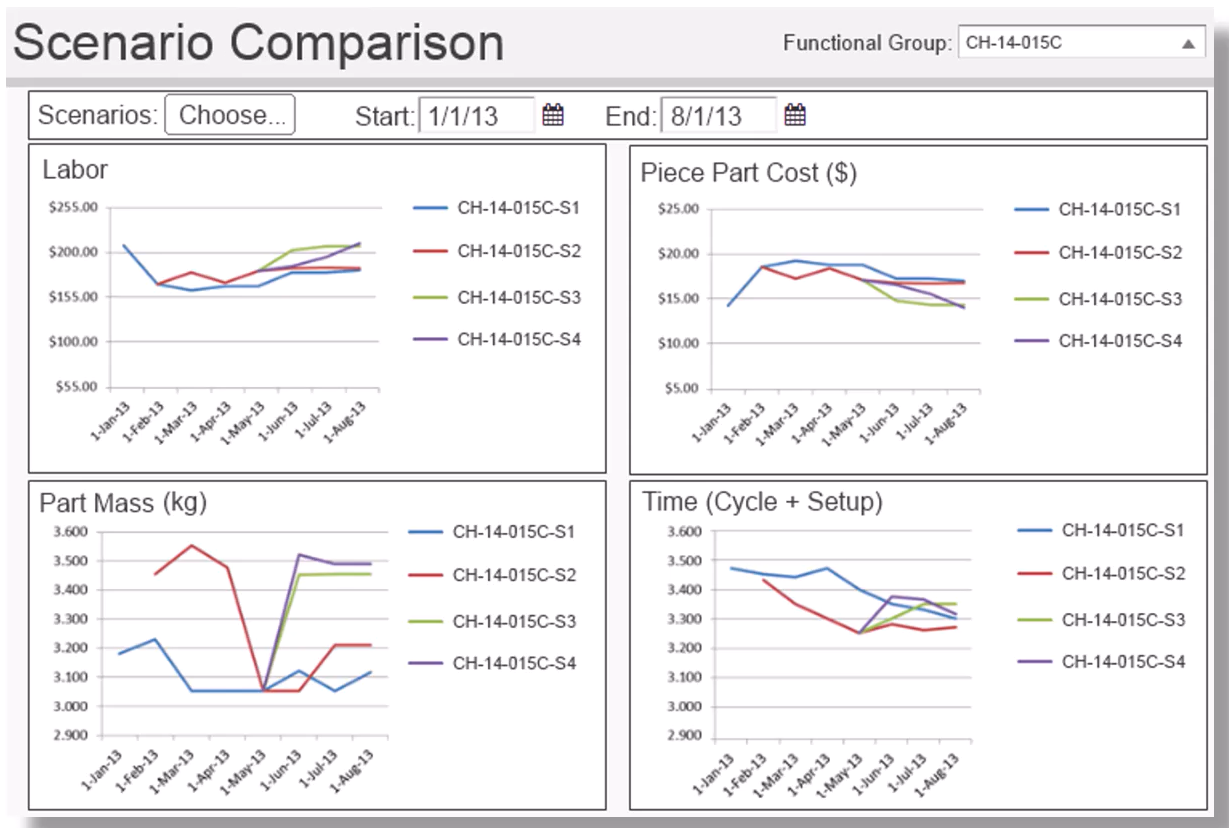
For example, you could create a dashboard for a scenario comparison filtered out by functional group, that looks at labor cost and cycle and setup time:
Dashboard functions
You can
Create a Dashboard
-
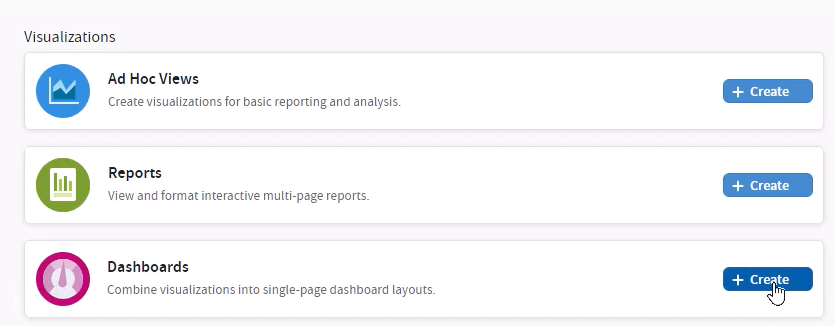
From the aP Analytics home screen, click Create on the Dashboards section.
-
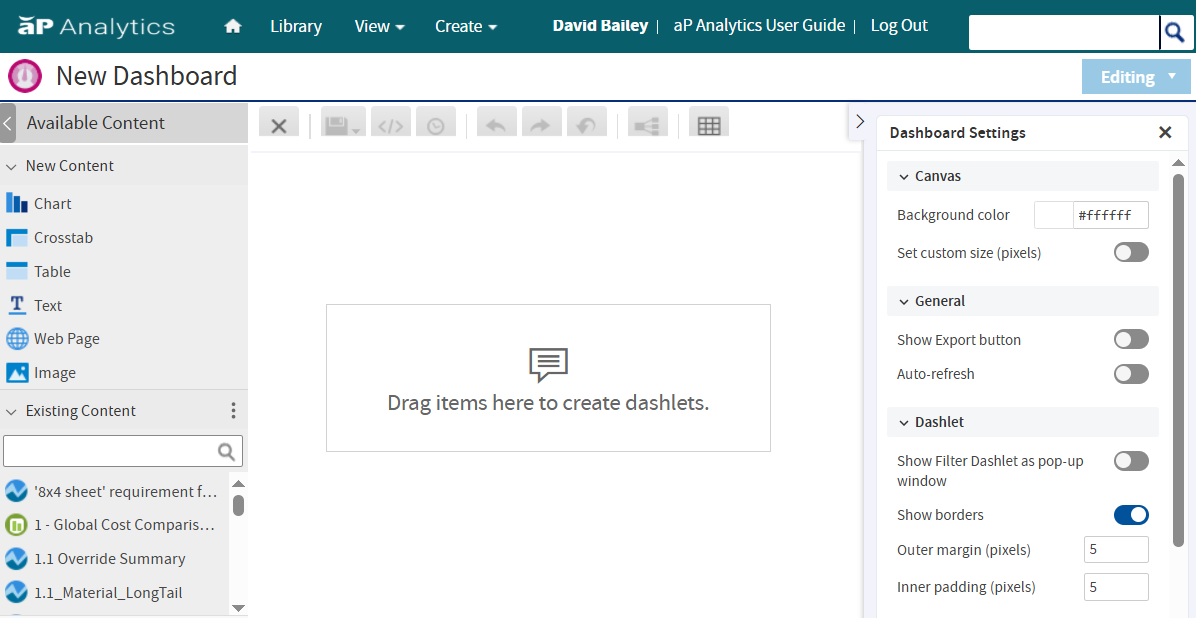
Use the Dashboard designer to add and edit content:
-
The left-hand panel shows content sources you can use (new or existing content).
-
The central area contains your dashboard contents.
-
The right-hand panel shows dashboard settings.
-
-
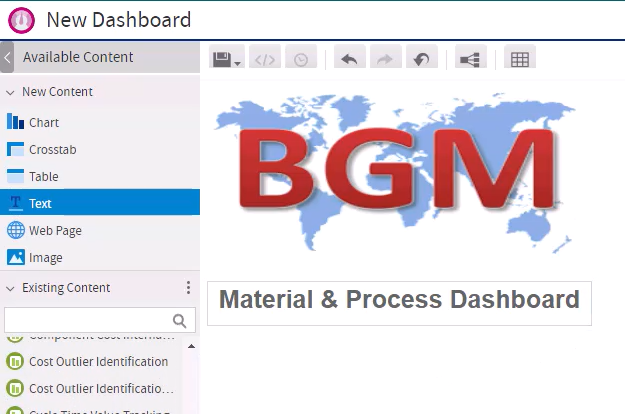
Use the New Content options to create new content in your dashboard, such as images and text. For example, to add a corporate logo:
- Select New Content > Image from the left-hand panel to load the image into aP Analytics.
- Click and drag the image into the main dashboard designer screen.
- Resize the image as needed by clicking on the bottom-right corner of the image. then size as needed.
-
Similarly, to add a title, select New Content > Text, then edit and arrange the text as needed
For example:
-
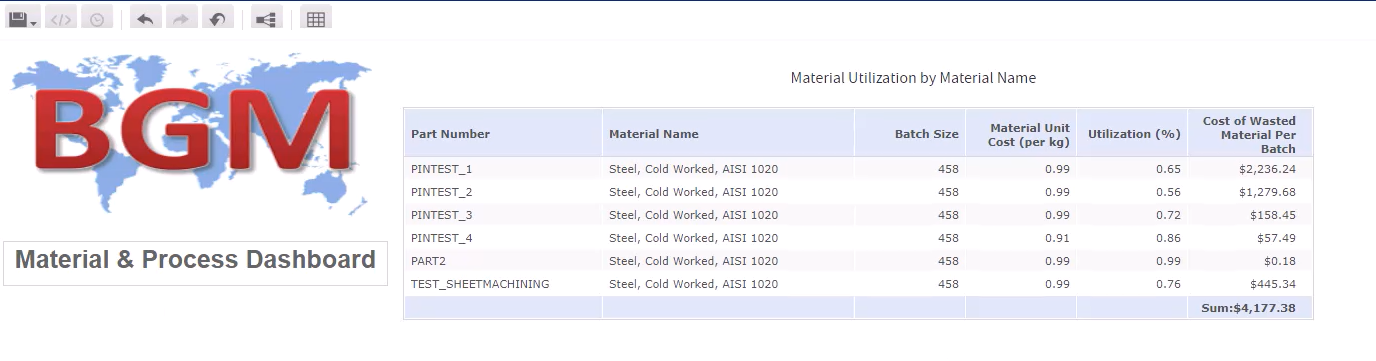
Use the Existing Content options to add existing content such as OOB reports to the dashboard. For example, to add the Material Utilization View report to your dashboard:
- Select Existing Content > Material Utilization View; click and drag this to the central area
- Resize this as appropriate.
For example:
-
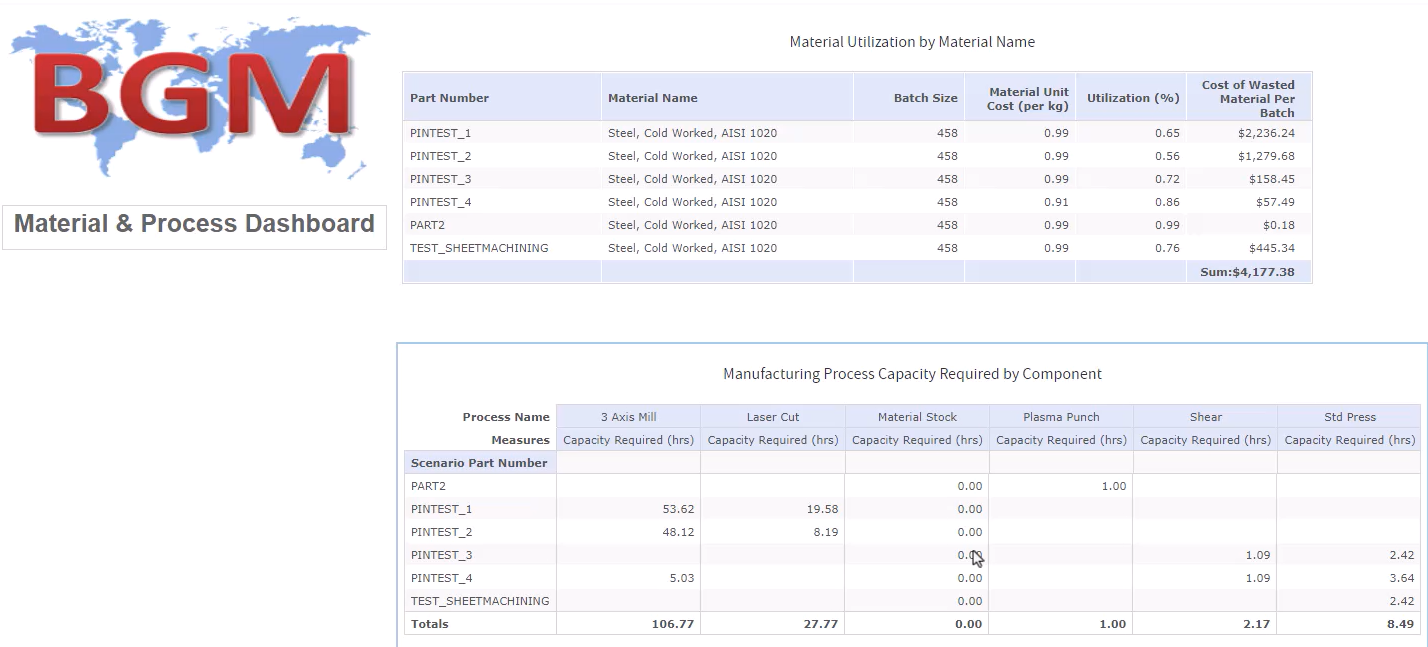
You can add multiple reports as dashlets to your dashboard. For you can add the Manufacturing Process Capacity Requirements Report.
-
To preview this dashboard, showing how your dashboard will be seen by other users, select Editing > Viewing on the top-right corner of your screen. To return to the editing screen, select Editing from the drop down menu again.
-
To control what content is displayed, use the Filters on the left-hand panel, in the same way as you can control reports and Ad Hoc views:
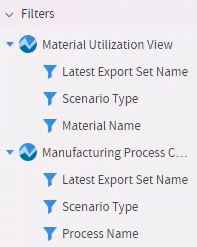 Drag and drop the filters required to the central area, then edit them as needed.
 -
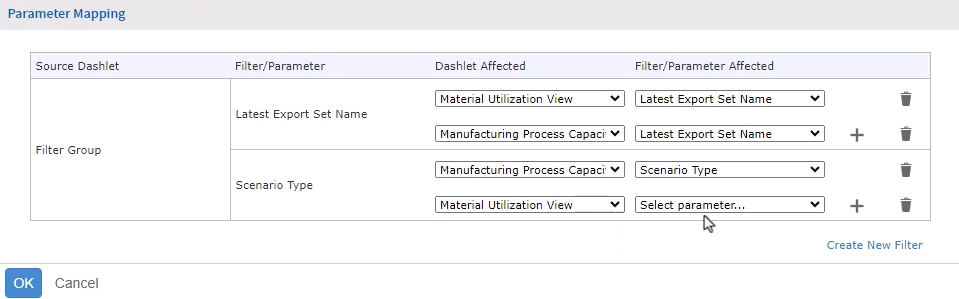
You can link filters using the parameter mapping button:
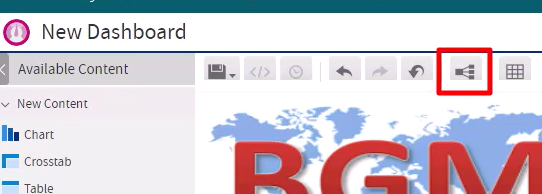 For example, to connect both filters to both dashlets:
-
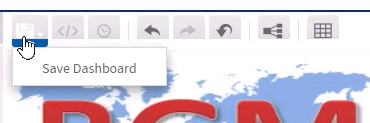
When you have finished creating the dashboard, click the Save Dashboard button:
-
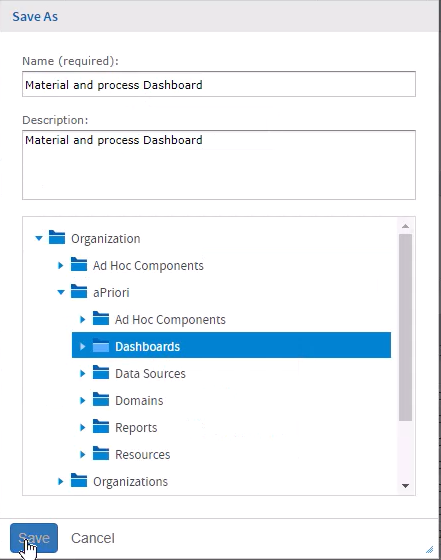
Select the location for your new dashboard:
Run a Dashboard
To run a created dashboard:
-
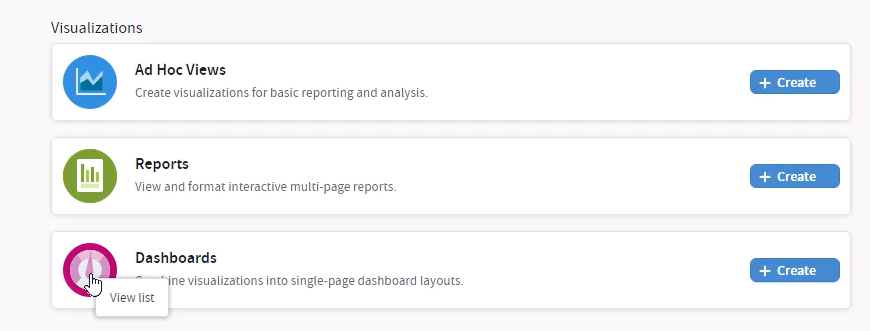
from the aP Analytics home page, hover over the dashboard icon:
-
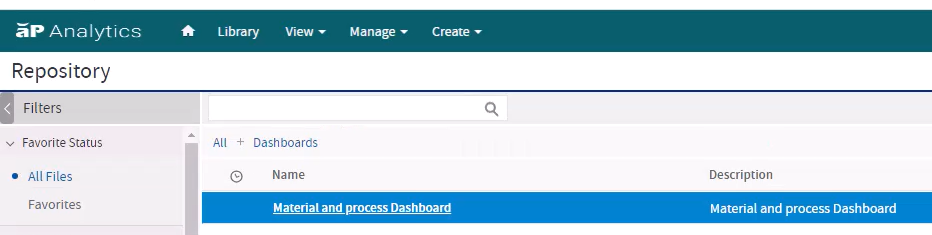
Click the icon to see and run available dashboards:
-
Select the dashboard to view. edit and run it.