Ad Hoc Support for Assemblies and Roll-ups
As of aP Analytics 2018 R3 SP1, Ad Hoc reports allow you to see the structure of assemblies and roll-ups, regardless of whether they are the top level of an export set, or are part of an All or Delta export. This new functionality allows you to see the structure (BOM hierarchy) of the assembly or rollup:
A BOM typically includes aggregate costs and conveys information such as:
- Parent child relationships
- Count in parent (or quantity)
- Level (the depth of the hierarchy)
Example creating an Ad Hoc assembly report
The following example shows you how you might export an assembly from aP Pro and then build an Ad Hoc report using the new Container Object Structure. (The procedure for building a report for a roll-up is very similar. See Notes about the container example for an exception.) You will not actually have the assembly illustrated in this example, but you can try substituting one from your company if available.
-
Assume that you have an assembly named CASE1_ASSEM in aP Pro as shown in the following screenshot.
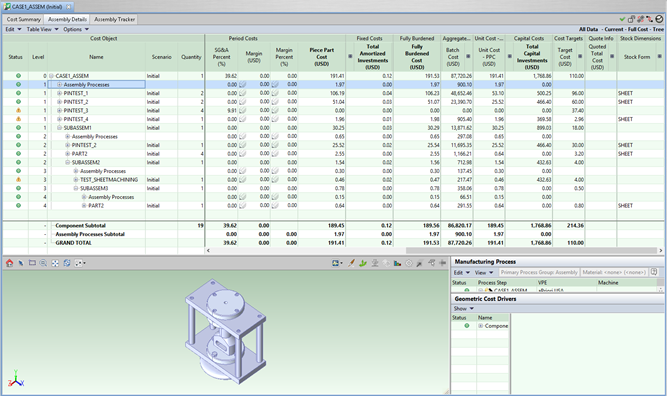 This isn’t a huge assembly, but it makes for a good example as it has nested subassemblies and some components that get reused at different levels.
 -
Further assume that this assembly has been exported to the aP Analytics reporting database as part of a regularly scheduled Export All or Export Delta operation.
-
Start a new Ad Hoc report as described in Ad Hoc-Report-Example, Steps 1 through 5.
-
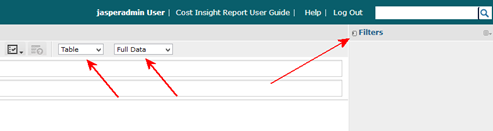
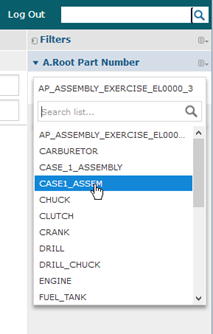
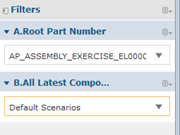
Set the pulldown menus and expand the filter panel as shown in the following screenshot.
-
To filter just this assembly, and to display just the most recently exported default scenarios (so you do not get multiple instances of the assembly, subassemblies, and components):
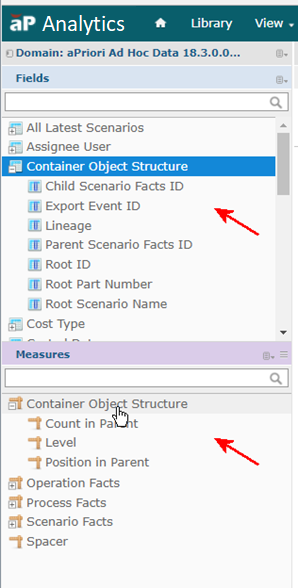
- Find Root Part Number in the Fields panel, then right click and select Create Filter.
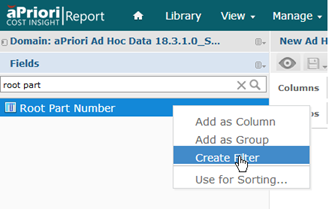
- In the newly created filter, select the assembly name (in this example, CASE1_ASSEM) from the pulldown menu.
- Create a second filter for All Latest Component Schema using the same procedure you just used for Root Part Number. Select Default Scenarios.
-
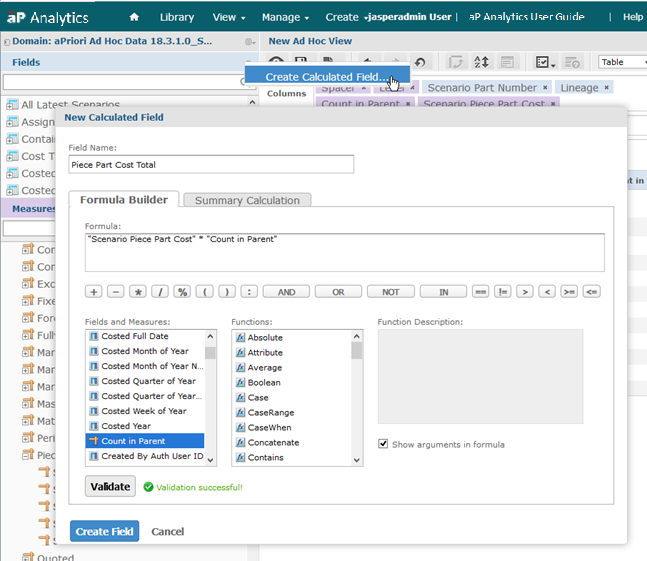
Before we populate this table with Fields and Measurements, we need to create one calculation:
- Click the menu at the right of the Fields title and click Create Calculated Field.
-
In the resulting New Calculated Field dialog box, construct the formula:
"Scenario Piece Part Cost" * "Count in Parent"then click Validate to test the calculation. (These steps are compressed together in the following screenshot.)
-
Click Create Field when done.
-
Populate the table by dragging and dropping the following from the Fields and Measures panels onto the Columns field in the order shown. (Use the Search feature to locate these if you have trouble browsing to them.)
- Spacer (measure)
- Level (measure)
- Scenario Part Number (field)
- Lineage (field)
- Count in Parent (Measure)
- Scenario Piece Part Cost (measure)
-
Piece Part Cost Total (field; this is the calculate field you defined in the previous step)
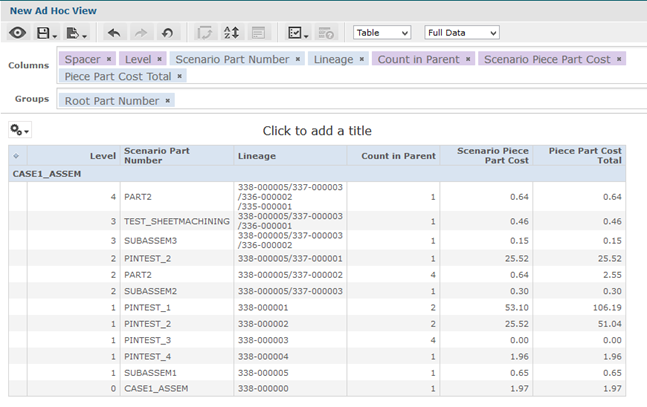
Similarly, drag and drop Root Part Number from the Field panel onto the Groups field. At this point, the table would look like the following screenshot:
-
Finalize the display with the following touch-ups:
- Click in the title area and provide a descriptive name, such as “Assembly Container Example”.
- Right-click the Count in Parent column header and change the label to “Quantity”.
-
Click the “A Z” icon in the toolbar and set the sort order to be based on the Lineage field (found under Container Object Structure). Sorting by this field causes the report table to reflect the same sort order shown for assemblies and roll-ups in the aP Pro detailed view.
Note:
You may prefer to remove the Lineage column to further clean up the table. You only need to sort on that field; you do not actually need to display it in the table.
-
The following screenshot shows the end result of the report table, and also shows how the table columns reflect their corresponding columns in the aPriori Pro Assembly Details display:
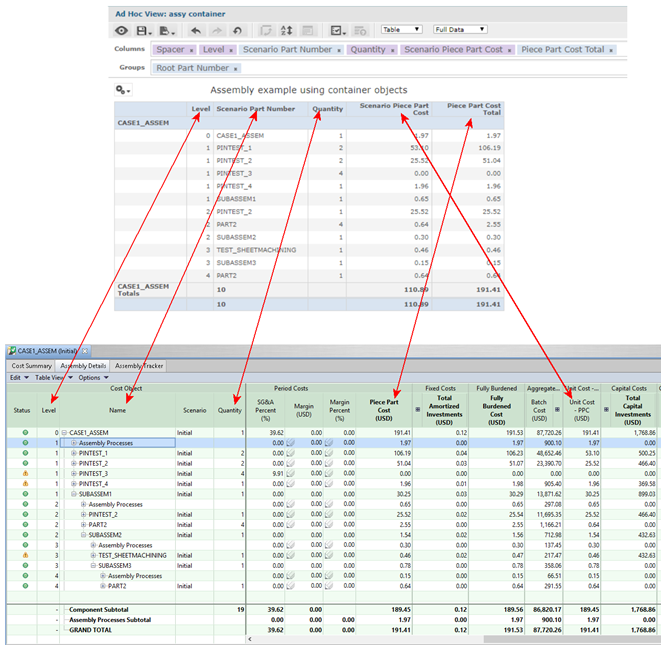
Note:
You may notice that in the above screenshot, the “Scenario Piece Part” total in the report ($110.89) differs from the “Unit Cost – PPC” total in the Assembly Details table ($189.45) The reason is that the Ad Hoc report and the Details table present the components in the same order, but are not doing exactly the same thing with the totals: the table is showing the aggregate totals for the subassemblies and the report is showing the cost for the assembly itself.
Notes about the container example
-
The previous example showed a top-level assembly and all of its subassemblies. However, each subassembly (or sub-rollup) can act as a root object. In other words, each subcomponent can act as a container object and using the methods described above you can easily narrow down your ad hoc view to just focus on the subcomponent objects associated with the selected root subcomponent.
-
In a production environment where your database is updated from regular export sets, you might need to use the Latest Export Event list and select the name of the specific export set you are interested in, using the Export Set Name field.
-
When working with dynamic roll-ups rather than assemblies, their root item level will always be “1” since the roll-up is an artificial grouping of components, unlike an actual assembly, and the user doesn’t add them to the container in a specified order.
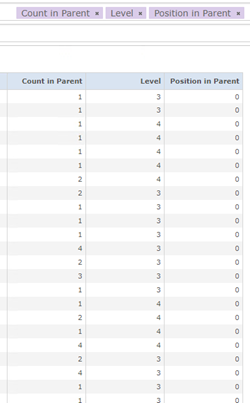
Important note about older containers
aPriori has discovered that assemblies and roll-ups created in aP Pro releases around 2014 may have incorrect (zero) values for child position_in_parent fields. This can cause the display of the container children at level two or below to be shown out of order. (It does not affect other calculations such as being able to get the full list of the scenarios in a container and do cost analysis on these scenarios.) In other words, you will have a container with items in it, but the value for Position in Parent will be set to zero for all items in the report, which doesn’t make logical sense.
You can fix older containers that exhibit this issue by performing a Save as > Scenario & Children on the roll-up or assembly in aP Pro and exporting it to aP Analytics. This has the downside of renaming all the scenarios, but may be worth it if you need to show the correct Position in Parent values.