Cost Categories and Scenarios
There are three basic types of scenarios and three basic cost categories that you might see when generating reports.
The scenario types are:
- Parts
- Assemblies
- Roll-Ups (ordinary and dynamic)
The cost categories are:
- Scenario
- Scenario Aggregate
- Scenario Aggregate OCS (Of Child Scenarios)
With the exception of Target Costs the behaviors of all costs are the same: the cost values will vary depending on which of the cost categories are being applied to which of the scenario types you are working with. Because assemblies and roll-ups are somewhat similar in that they both aggregate cost metrics, there can be confusion when looking at the cost categories for these scenarios. The main difference between a roll-up and an assembly is that an assembly itself has a cost, while a roll-up is simply an artificial grouping of scenarios and has no cost of its own.
The following table uses Fully Burdened Cost (“FBC”) as an example. The same basic table could be used for Material Cost, Piece Part Cost, Programming Cost, etc.
| General Description |
Part | Assembly | Roll-Up | |
|---|---|---|---|---|
| Scenario FBC | Fully Burdened Cost of the scenario | Piece Part Cost. Always same as Scenario Aggregate FBC. (Parts have no children.) | The cost of the assembly itself | Always zero. (There is no cost associated with the roll-up itself.) |
| Scenario Aggregate FBC | Fully Burdened Cost of the scenario plus any children | Always same as Scenario FBC. (Parts have no children.) | The cost of the assembly PLUS the cost of all its children. (Scenario Aggregate FBC = (Scenario FBC + Scenario Aggregate FBC OCS) | The cost of the roll-up (always zero) PLUS the cost of all its children. Always same as Scenario Aggregate FBC OCS. |
| Scenario Aggregate FBC OCS | Fully Burdened Cost Of Child Scenarios only | Always zero. (Parts have no children.) | The cost of just the children in the assembly. | The cost of the children in the roll-up. Always same as Scenario Aggregate FBC. |
Note:
This discussion has focused on Aggregate and Aggregate OCS behavior for costs (i.e., monetary values). However, aPriori provides Aggregate and Aggregate OCS fields for many non-cost values, such as time (cycle time, labor time, setup time) and mass (finish mass, rough mass, scrap mass). These areas have the same structure with Aggregate and Aggregate OCS fields.
Target Costs
Target cost is an exception to the aggregation behavior described by Cost categories and Scenarios.
For example, a Scenario Target Cost for an assembly includes the cost of the assembly PLUS the cost of all its children (parts). But a Scenario FBC Cost for an assembly contains ONLY the cost of the assembly. And while the Scenario Aggregate Target Cost and the Scenario Aggregate Target Cost OCS for an assembly are always the same (that is, they both show the aggregate costs of all the children), their FBC counterparts are different. The Scenario Aggregate FBC Cost OCS shows only the cost of the assembly’s children, while the Scenario Aggregate FBC Cost shows the sum of the cost of the assembly itself PLUS the cost of all its children – in other words, it is more similar to Scenario Target Cost
Compare the Assembly and Roll-Up columns in this Target Cost table to the same columns in the previous table:
| General Description |
Part | Assembly | Roll-Up | |
|---|---|---|---|---|
| Scenario Target Cost | Target Cost of the scenario | Piece Part Cost. Always same as Scenario Aggregate Target Cost. (Parts have no children.) | The cost of the assembly PLUS the cost of all its children. | The cost of all the children in the roll-up. |
| Scenario Aggregate Target Cost | Target Cost of the scenario plus any children | Always same as Scenario Target Cost. (Parts have no children.) | The cost of all the children in the assembly. (Same as Scenario Aggregate Target Cost OCS.) | The cost of all the children in the roll-up. |
| Scenario Aggregate Target Cost OCS | Target Cost Of Child Scenarios only | Always zero. (Parts have no children.) | The cost of all the children in the assembly. (Same as Scenario Aggregate Target Cost.) | The cost of all the children in the roll-up. |
Consider the following example:
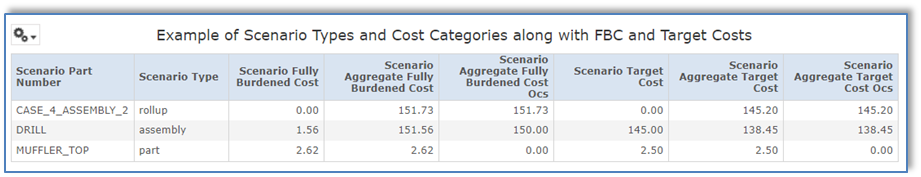
The drill assembly’s FBC is $1.56 (just the cost of the assembly itself). The aggregate FBC is $151.56 (the cost of the assembly PLUS all its children).
However, the drill assembly’s Target Cost is $145 – the cost of the assembly PLUS the cost of all its children. It is a target for the whole assembly, not a target just for the assembly process.
So to compare an assembly target cost to its fully burdened cost, you need to compare the value of Scenario Target Cost against the value of Scenario Aggregate FBC.
A roll-up is different: there is no cost to the roll-up itself, just to the sum of its children. So to compare a roll-up target cost against a roll-up FBC, you could use either Scenario Aggregate Target Cost or Scenario Aggregate Target Cost OCS and compare it against either Scenario Aggregate FBC or Scenario Aggregate FBC OCS.
The example above shows the display names as they would appear to an Ad Hoc report user. These display names map to database names as follows:
| Display Name | DB Name (ID) |
|---|---|
| Scenario Part Number | part_number |
| Scenario Target Cost | target_cost |
| Scenario Aggregate Target Cost | aggr_target_cost |
| Scenario Aggregate Target Cost Ocs | aggr_target_cost_ocs |
| Scenario Fully Burdened Cost | fbc |
| Scenario Aggregate Fully Burdened Cost | aggr_fbc |
| Scenario Aggregate Fully Burdened Cost Ocs | aggr_fbc_ocs |