General Cost, Scenario Comparison, and Cost Avoidance Reports¶
General reports allow you to examine and share information about how much part and assembly scenarios cost, the relative cost of multiple scenarios, and costs that you avoided by updating scenario inputs or engineering designs.
- Assembly Cost Reports
- Assembly Details Report
- Cost Avoidance Reports
- Component Cost Reports
- Scenario Comparison Reports
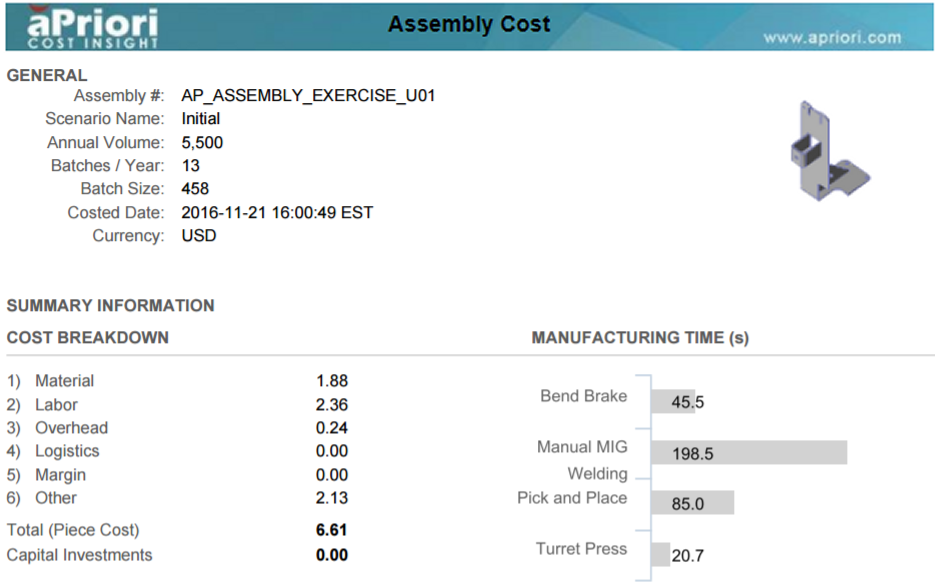
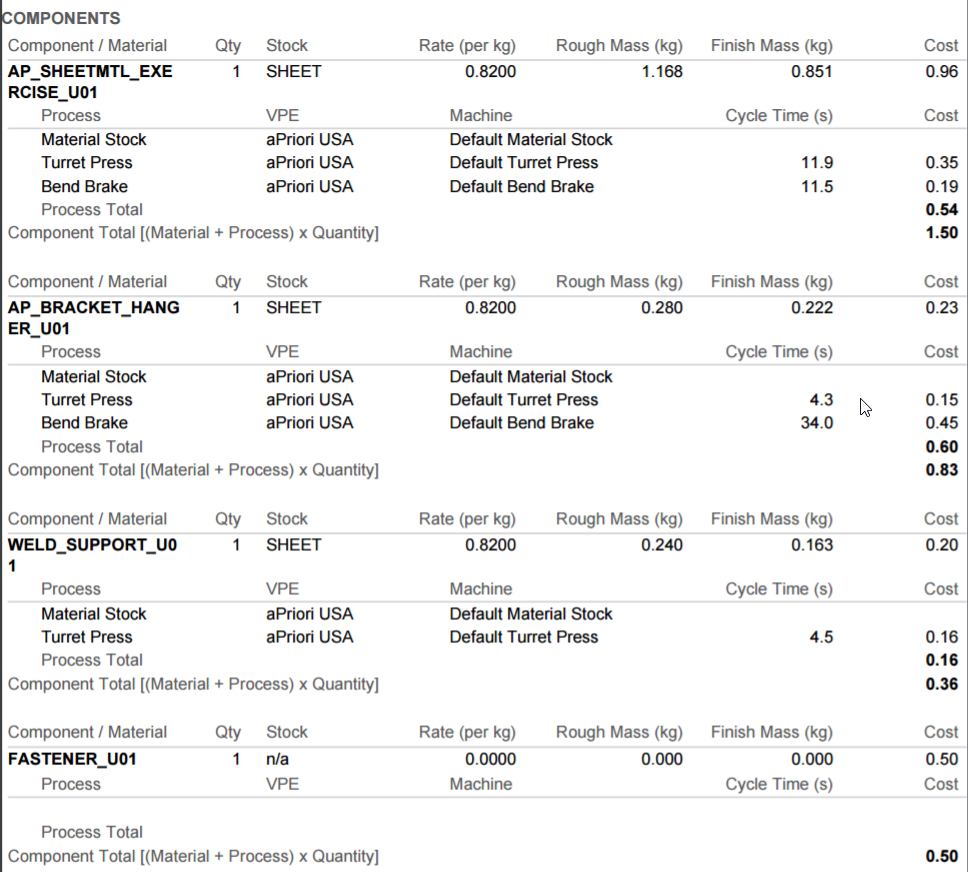
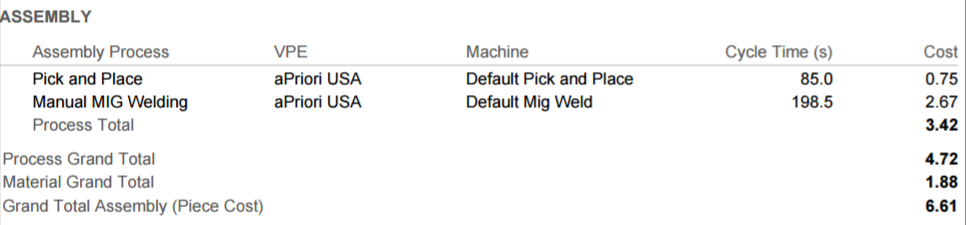
Assembly Cost Reports¶
The Assembly Cost reports provide an overview of a costed aPriori assembly.
Info
See the Estimate Manufacturability and Cost tutorial for an example of using this report.
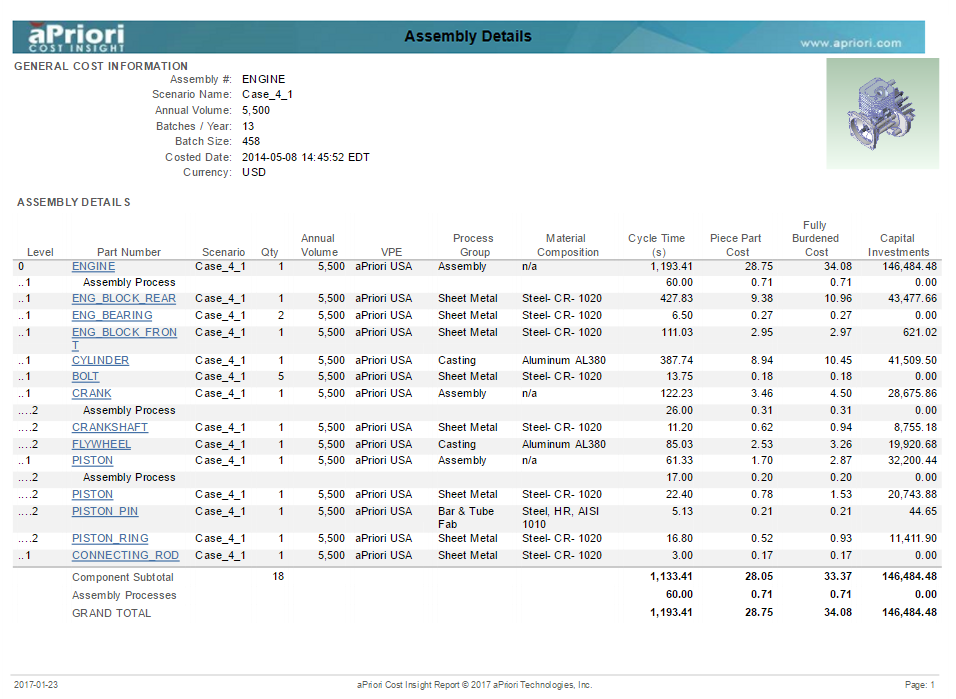
Assembly Details Report¶
The Assembly Details report generates a flattened list that includes the cost data, assembly level, and quantity for all the components of an assembly. The Part Number for each component is linked to a Component Cost report that includes the cost breakdown for that component.
Cost Avoidance Reports¶
Cost Avoidance Reports allow Project Managers and Leaders to track Cost Avoidance over the component design process. Cost Avoidance can be aggregated at the component level, across a set of components, and annually. Cost Avoidance is calculated as the cost difference between the cost of a component design starting point and the cost of a component design ending point.
Automated Cost Avoidance¶
Automated Cost Avoidance reports track the Highest Cost Scenario, the Latest Cost Scenario, and the Cost Avoidance (difference) in the reporting database.
Automated Cost Avoidance includes two reports:
- An aggregate level Automated Cost Avoidance report that displays Cost Avoidance across all costed components that meet the input control criteria.
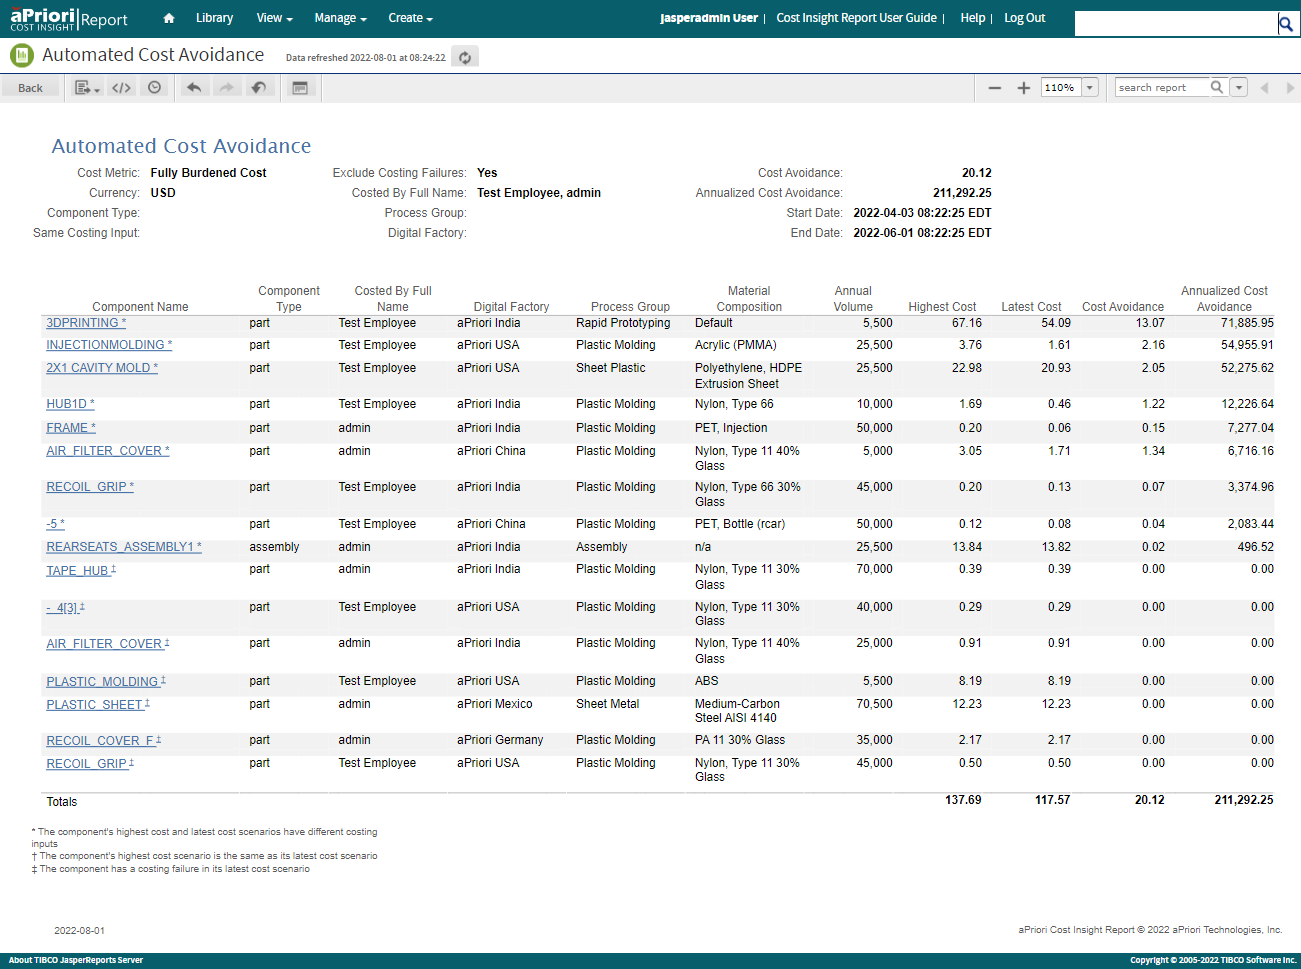
- A component-specific Cost Avoidance Scenario Comparison sub-report that compares a component’s highest and latest scenarios.
Automated Cost Avoidance Calculation¶
Cost Avoidance is calculated for each component as the cost difference between the Highest Cost Scenario and Latest Cost Scenario, where a unique component is defined by the combination of its part number (also referred to as component name), scenario name, component type, and component schema. This calculation provides a best estimation of Cost Avoidance without requiring manual selection of scenarios by the design engineer. The Highest Cost Scenario represents a design starting point, that is, when a component is first fully featured. The Latest Cost Scenario represents the current component design. As design improvements are made, the difference between the highest and Latest Cost Scenarios will be captured as the Cost Avoidance value.
Setting Highest Cost Metric to Enable the Automated Cost Avoidance Report¶
To allow the reporting database to track a Highest Cost Scenario, you must set a cost metric that determines the Highest Cost Scenario selection. Options for the Highest Cost metric are:
- Fully Burdened Cost
- Piece Part Cost
- Total Variable Cost
To defer tracking the Highest Cost Scenario, set the Highest Cost metric value to None, which is an empty value in the database. Once a non-empty value is set, you cannot change the Highest Cost metric value because doing so would force you to restart tracking cost avoidance. The Automated Cost Avoidance report becomes populated with data only when a Highest Cost metric is set because the data depends on the automatic tracking of Highest Cost Scenarios.
To learn how to set the Highest Cost metric, for an aPriori:
- On-Premise deployment, please see the aP Analytics & aP Admin On-Premise Installation Guide.
- Cloud deployment, please contact aPriori Support.
Tracking Highest Cost Scenario in the Reporting Database¶
When an aP Admin job exports a scenario to the reporting database, aP Analytics compares the values for the Highest Cost metric of the exported scenario to that of the current Highest Cost Scenario. If the value for the newly exported scenario is greater, the newly exported scenario becomes the Highest Cost Scenario for the component.
Important:
Highest Cost Scenarios are not removed from the reporting database by a reporting database purge.
Example Workflow¶
A typical workflow for generating the Automated Cost Avoidance report includes these steps:
- Design engineer initiates costing of a component in any application
- Design engineer iterates on component design, applying cost and manufacturability feedback, and uses a consistent scenario name to represent a unique component
- Regular export process moves scenarios to Reporting database, where the Highest Cost Scenario is tracked
- Project Manager or Leader runs the Automated Cost Avoidance report in aP Analytics to track Cost Avoidance at component and aggregate levels.
Input Control¶
The input control for the Automated Cost Avoidance report prompts you to enter the information that is described in this table.
| Field | Description |
|---|---|
| Earliest / Latest Cost Date | Date range that specifies: - When the Latest Cost Scenario was costed - The period of interest for the Cost Avoidance Report. |
| Currency Code | Display currency for the report results. |
| Sort Order | Condition for sorting data in the report columns |
| Component Type | Multi-select menu with these options: - Part - PCB Part - Assembly |
| Costing Inputs Must Be the Same | Multi-select menu of costing inputs that must be the same between highest and latest scenarios. The options are - Annual Volume - Batch Size - Digital Factory - Material Composition - Process Group |
| Exclude Costing Failures | Option to include or exclude components with a costing failure in their Latest Cost Scenario. Note: This report considers an Incomplete costing status to be a failure. |
| Costed By Full Name | Costing Users that you want to include in the report. This filter applies to the Latest Cost Scenario. |
| Process Group | Process Groups that you want to include in the report. This filter applies to the Latest Cost Scenario. |
| Digital Factory | Digital Factories that you want to include in the report. This filter applies to the Latest Cost Scenario. |
Flags¶
Three types of flags can be observed next to a component name in the Automated Cost Avoidance report:
- * – The component’s highest and latest scenarios have different costing inputs (please see the above table for the complete list of costing inputs).
- † – The Highest Cost Scenario is the same as the Latest Cost Scenario, for example if there is only one export of the scenario in the reporting database.
-
‡ – The component has a costing failure in its Latest Cost Scenario.
Note:
This report considers an Incomplete costing status to be a failure.
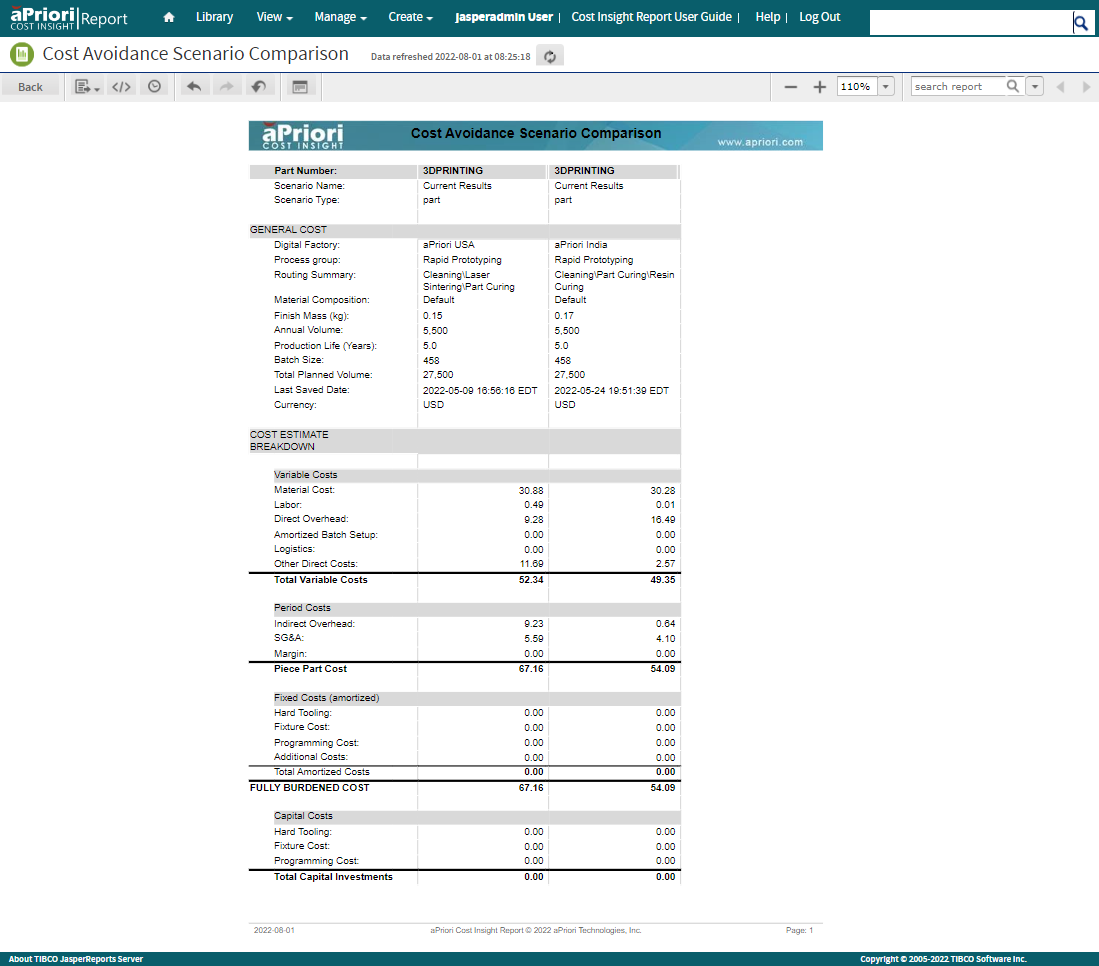
Cost Avoidance Scenario Comparison Sub-report¶
Each Component Name listed in the Automated Cost Avoidance report is linked to a Cost Avoidance Scenario Comparison sub-report that compares the details of costing inputs results between the Highest cost and the Latest cost scenarios. To launch the sub-report, click the Component Name.
Basic Cost Avoidance¶
The Basic Cost Avoidance report is an aggregate level report that displays Cost Avoidance across all costed components that meet the input control criteria.
To generate a Basic Cost Avoidance Report, you must manually select and name scenarios for Cost Avoidance calculation according to a specific convention.
Basic Cost Avoidance Naming Convention and Calculation¶
For the Basic Cost Avoidance report, Cost Avoidance is calculated for a component as the cost difference between the scenario that is named ‘Initial’ and the scenario that is named ‘Final’, where a unique component is defined by the combination of its part number (also referred to as component name), component type, and component schema. The scenario named ‘Initial’ represents a design starting point, when a component is first fully featured. The scenario named ‘Final’ represents the design ending point when cost and manufacturability design improvements have been made. Components must have one scenario named ‘Initial’ and one scenario named ‘Final’ to be picked up by the report. Components with a costing failure in either the ‘Initial’ or ‘Final’ scenarios will not contribute to Cost Avoidance calculations.
Note:
This report considers an Incomplete costing status to be a failure.
Example Workflow¶
A typical workflow for generating a Basic Cost Avoidance report includes these steps:
- Design engineer costs a fully featured component in any aPriori application, using the scenario name ‘Initial’
- Design engineer saves the component under a new scenario name, ‘Final’, and iterates on the component design, applying cost and manufacturability feedback
- Regular export process moves scenarios to Reporting database
- Project Manager or Leader runs the Basic Cost Avoidance report in aP Analytics where ‘Initial’ and ‘Final’ scenarios are used to calculate Cost Avoidance at component and aggregate levels.
Input Control¶
The input control for the Basic Cost Avoidance report prompts you to enter the information that is described in this table.
| Field | Description |
|---|---|
| Earliest / Latest Cost Date | Date range that specifies: - When the Final Scenario was costed - The period of interest for the Cost Avoidance Report. |
| Cost Metric | Display metric for the report results. The options are: - Fully Burdened Cost - Piece Part Cost - Total Variable Cost |
| Currency Code | Display currency for the report results. |
| Sort Order | Condition sorting data in the report columns (descending or alphabetical order) |
| Components Criteria | Multi-select menu with these options: - All Components - Components that Contribute to Cost Avoidance Calculation - Components that Do Not Contribute to Cost Avoidance Calculation Note: Components that have a scenario costing failure (including those with an Incomplete costing status) or that do not have an Initial scenario do not contribute to Cost Avoidance calculations. |
Flags¶
Four types of flags can be observed next to a component name in the Basic Cost Avoidance report:
- * – The Initial and Final scenarios for the component have different costing inputs.
- † – The component does not have a scenario that is named ‘Initial.’
-
‡ – The component has a costing failure in one or both its scenarios.
Note:
This report considers an Incomplete costing status to be a failure, as indicated by the '-' symbol in report table.
-
- – The scenario has a costing failure.
Negative Values¶
If the cost value for the Initial scenario is less than the cost value for the Final scenario, the Cost Avoidance is a negative value. Negative values are displayed in red font and are surrounded by parentheses.
For example, -12 is displayed as 
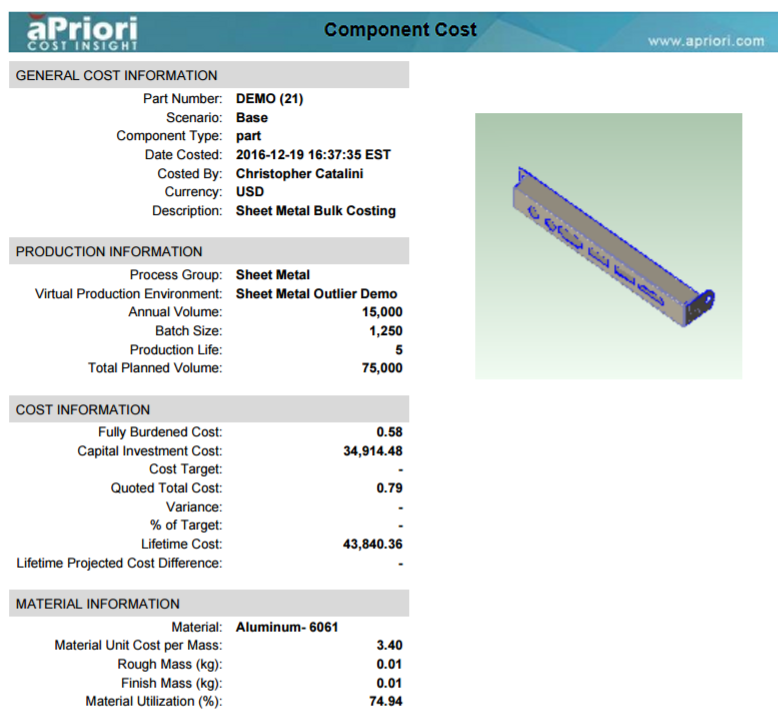
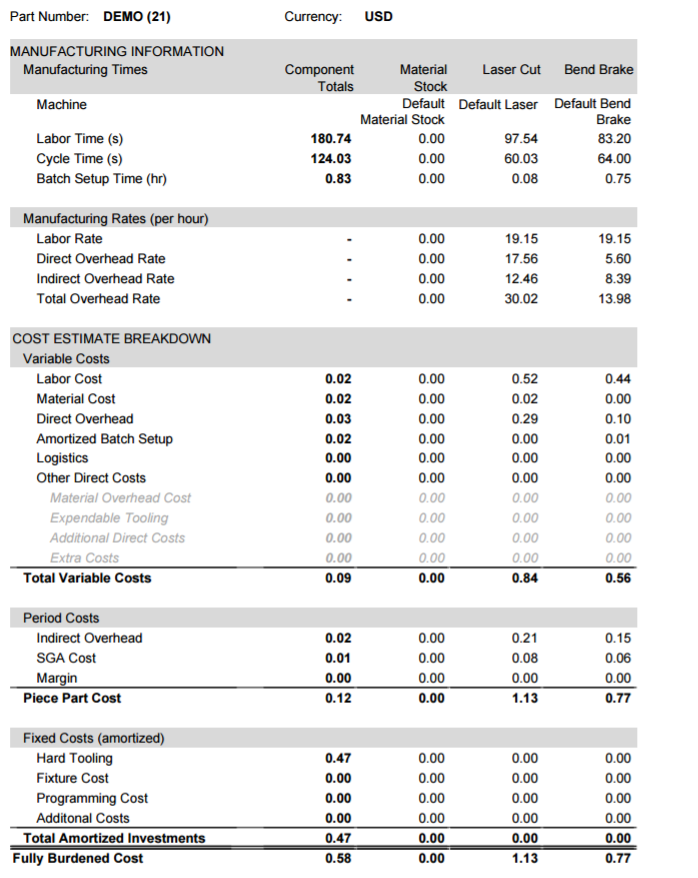
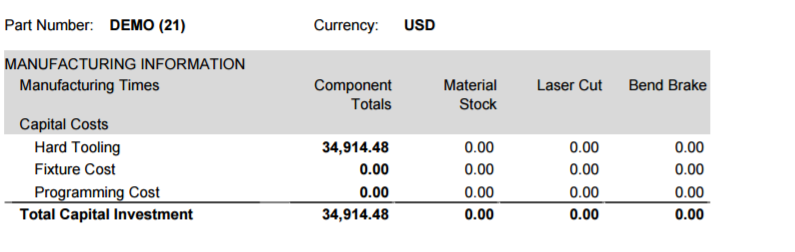
Component Cost Reports¶
The Component Cost report, which is similar to the spreadsheet Part Cost report in aP Pro, is intended for cost engineers, design engineers, and sourcing personnel. For example, it could be used as an aid for a sourcing specialist when renegotiating quotes with suppliers. This is another good place to start to get familiar with aP Analytics capabilities.
This out-of-box report requires no special set-up other than to create and execute one or more export sets consisting of the costed components (parts or assemblies) to be used in the report.
You can specify multiple export sets when generating the reports, and the dialog accepts wildcards to help you filter the components that you want to include.
The first page is a summary page, and the following pages show details at the process level. When generating the report for an assembly, the first page shows the fully-burdened cost of the assembly and all of its children, while the succeeding pages show aggregated costs of just assembly processes -- not of any of the children.
Scenario Comparison Reports¶
Although you can use the Scenario Comparison report to see the costing results for a single scenario, the report is designed to enable you to compare two or more scenarios for the same part. Comparing multiple scenarios allows you to see how changing factors such as design details, volume, and factory location affect the costing results.
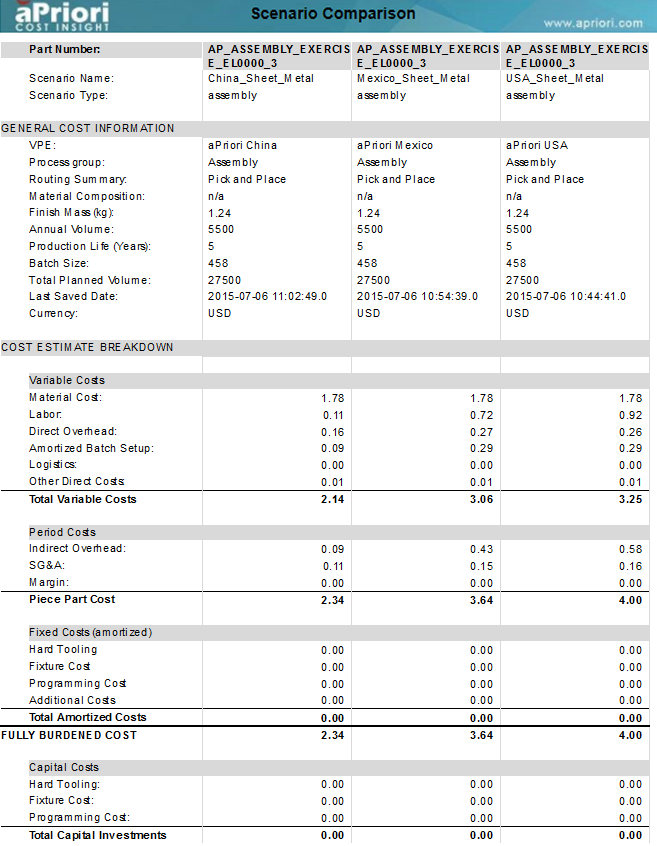
The Scenario Comparison report requires no set-up beyond exporting the scenarios of interest from your Operational database to your reporting database by using aP Admin. However, if you compare more than three scenarios, an exported report can span several pages of a PDF document. For a detailed information on setting the Input Control fields to achieve your desired results, see Using the Input Controls for DTC and Comparison Reports.
Note:
To display the costs in a Scenario Comparison report in a currency other than the Reporting database currency, you must first use System Data Export to populate the currency exchange rate table. For information about exporting currency rates, see the “Manage System Data Export” section of the aP Admin User Guide.