Sourcing Reports
Info
See the Sourcing Tutorials for specific examples of using these reports.
Cost Outlier Identification
Info
See Spend Analysis for details of using this report.
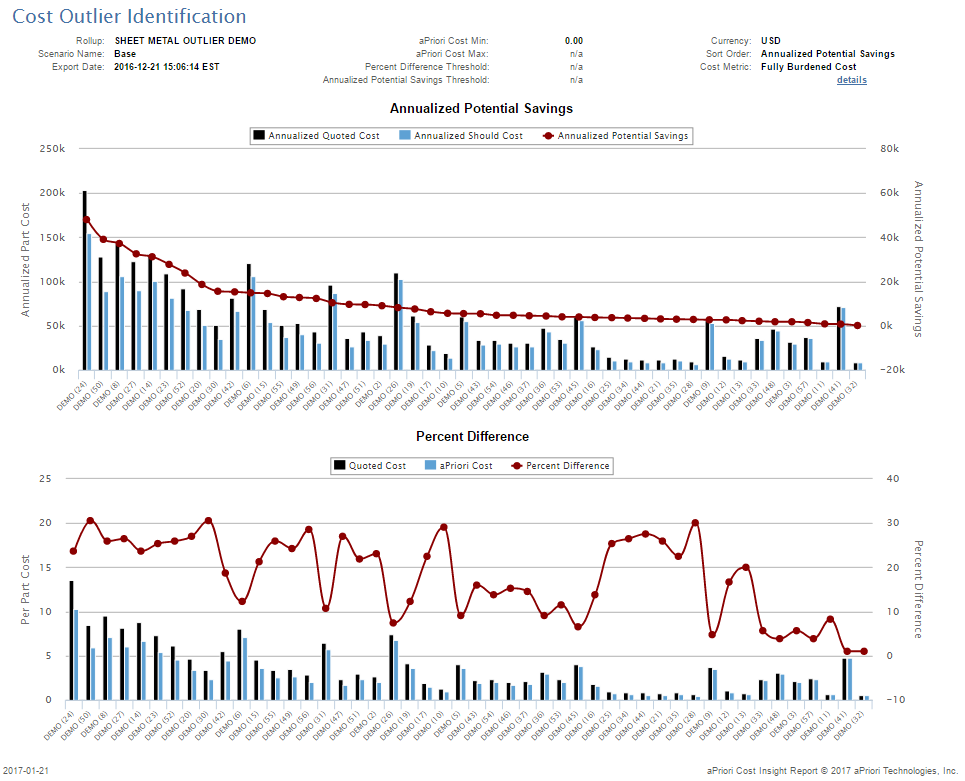
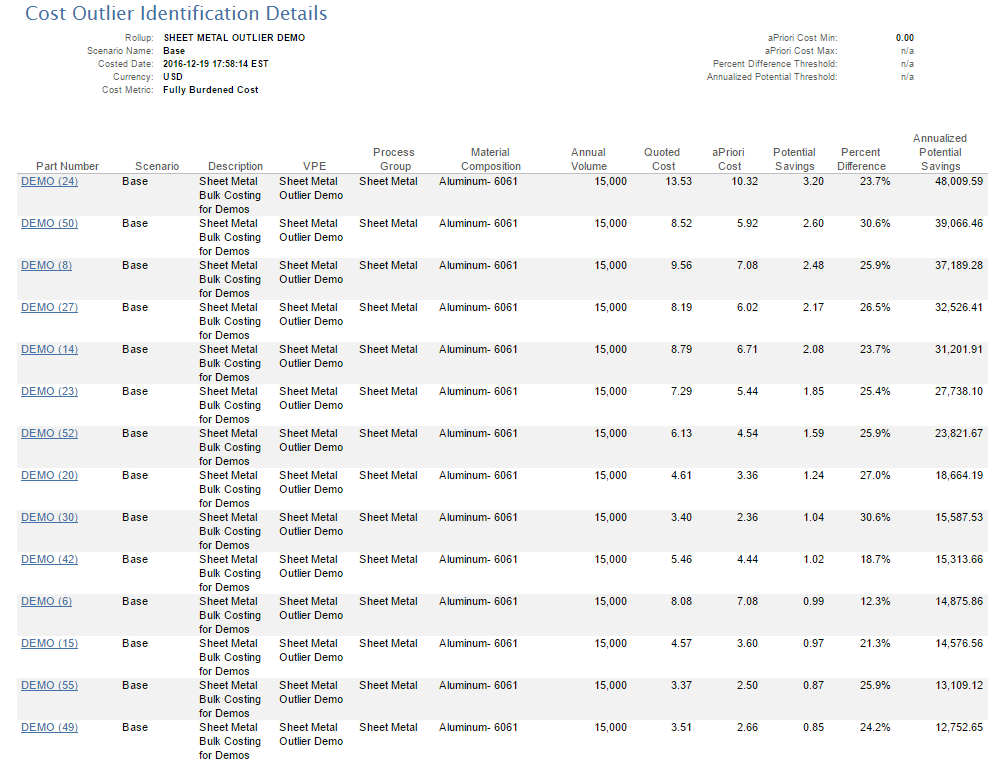
Cost Outlier Identification Details
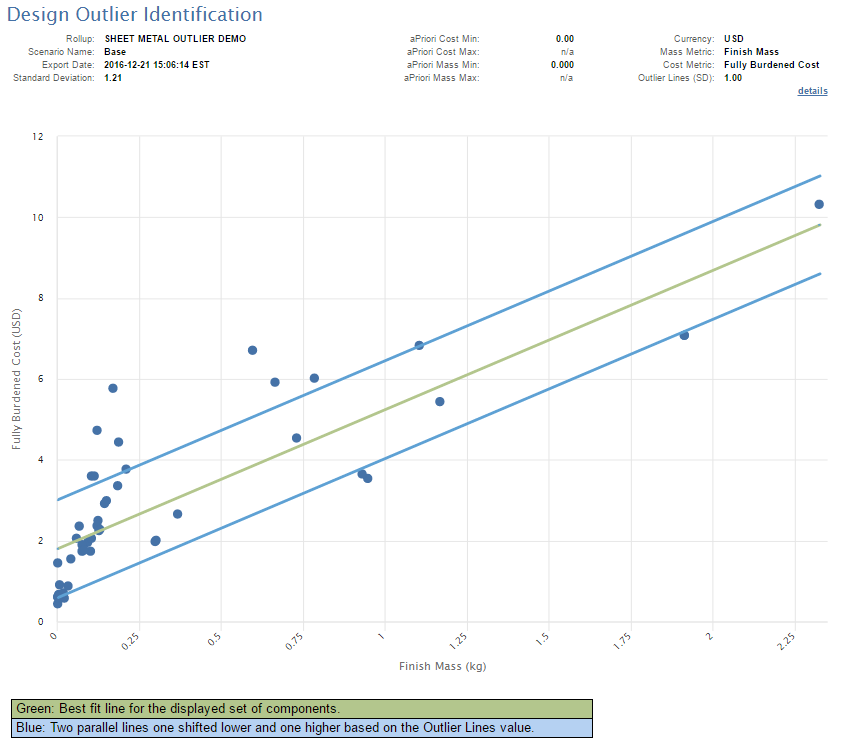
Design Outlier Identification
Info
See Design Analysis for an example of using this report.
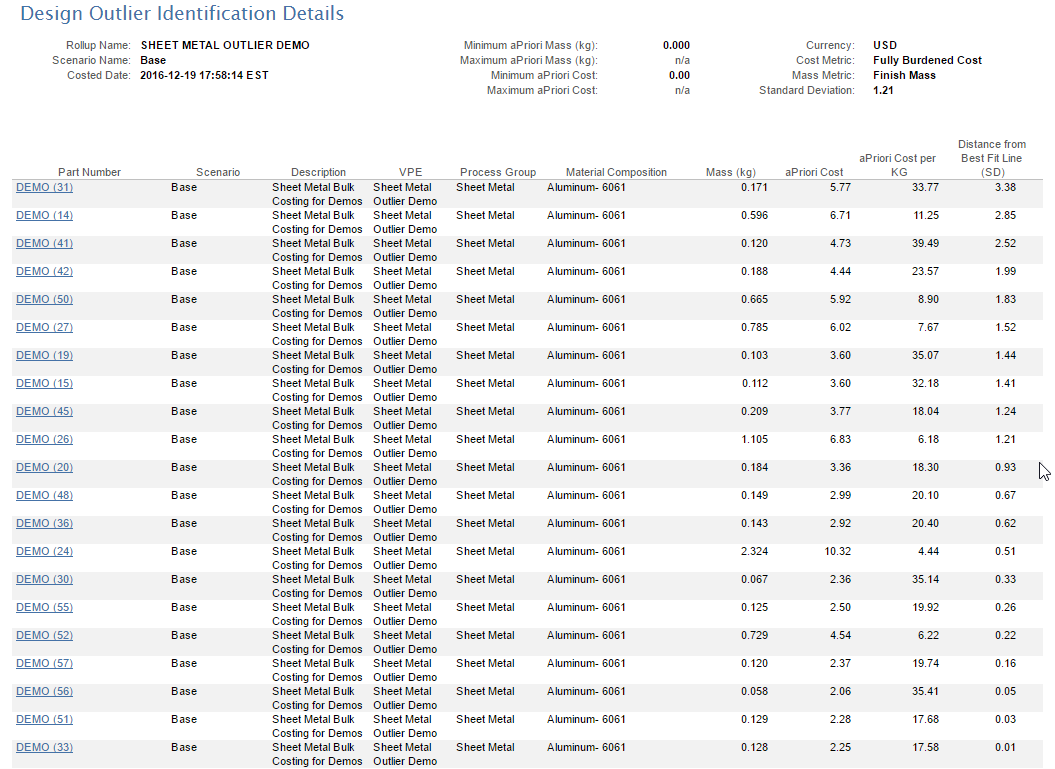
Design Outlier Identification Details
Spend Analysis Value Tracking
Run the Report
-
In aP Pro, create three roll-ups in aP Pro - see Using Roll-ups) .
-
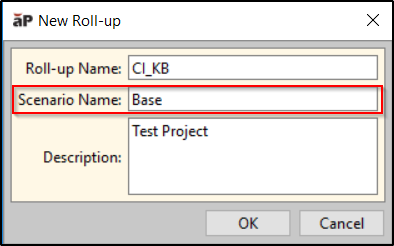
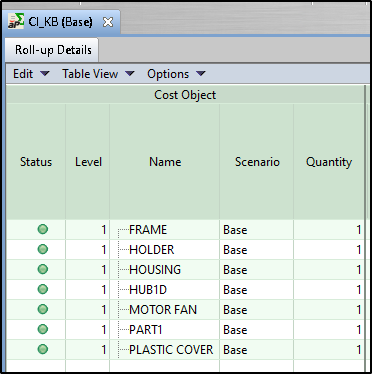
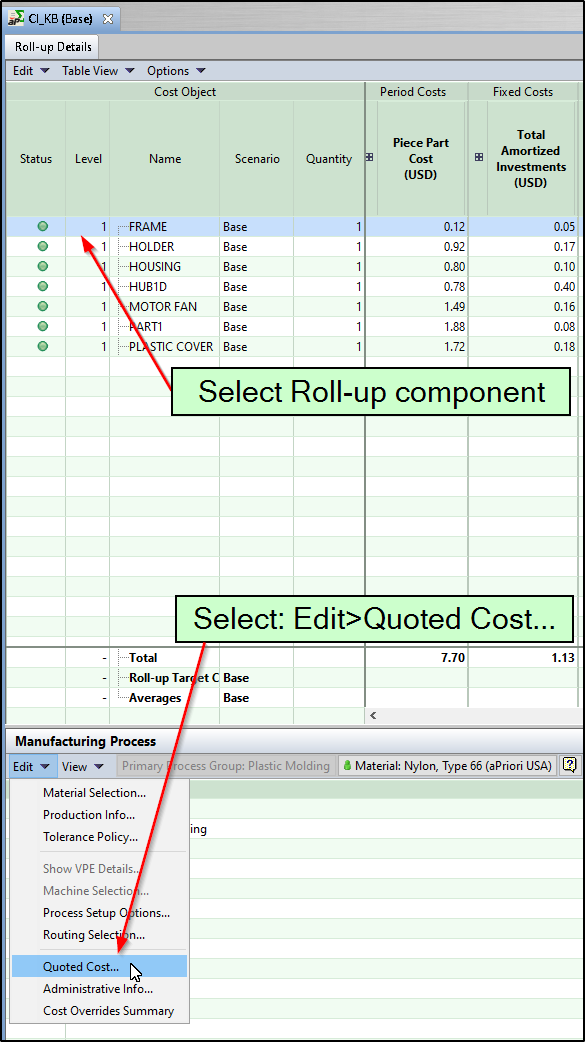
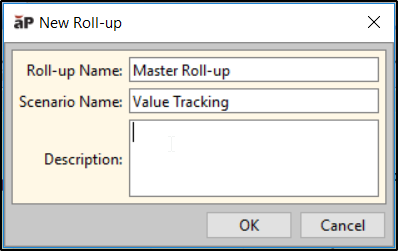
An initial roll-up containing relevant components, with initial scenarios representing the starting point for each component, and with an assigned initial cost for each component. For example:
-
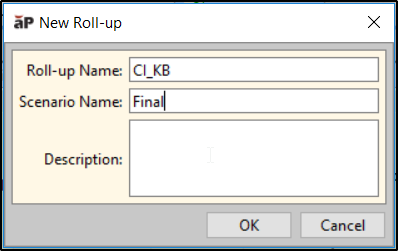
A roll-up containing the most recent scenario and costs for each of these components. For example:
-
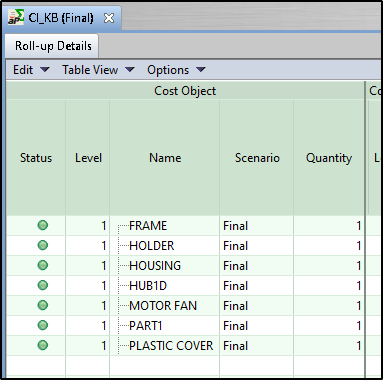
A Value Tracking roll-up to use for the comparison, containing both previously-created roll-ups. For example:
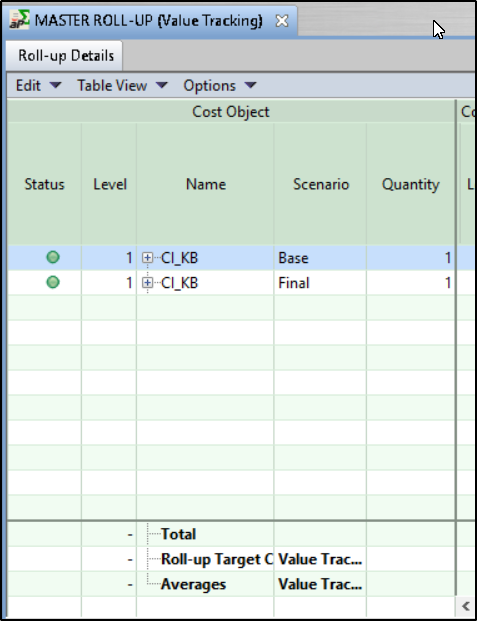
-
-
Export this Value Tracking roll-up to aP Analytics.
- In aP Analytics, select Reports > Spend Analysis Value Tracking.
-
The Input Controls dialog appears; select the previously-exported Value Tracking Roll-up, Export Date, Cost Metric and Currency:
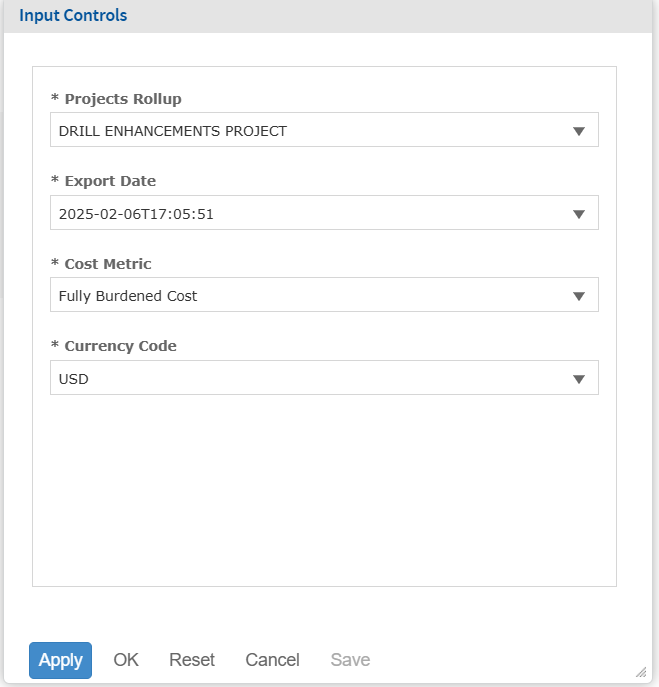
-
Click OK to create and display the report
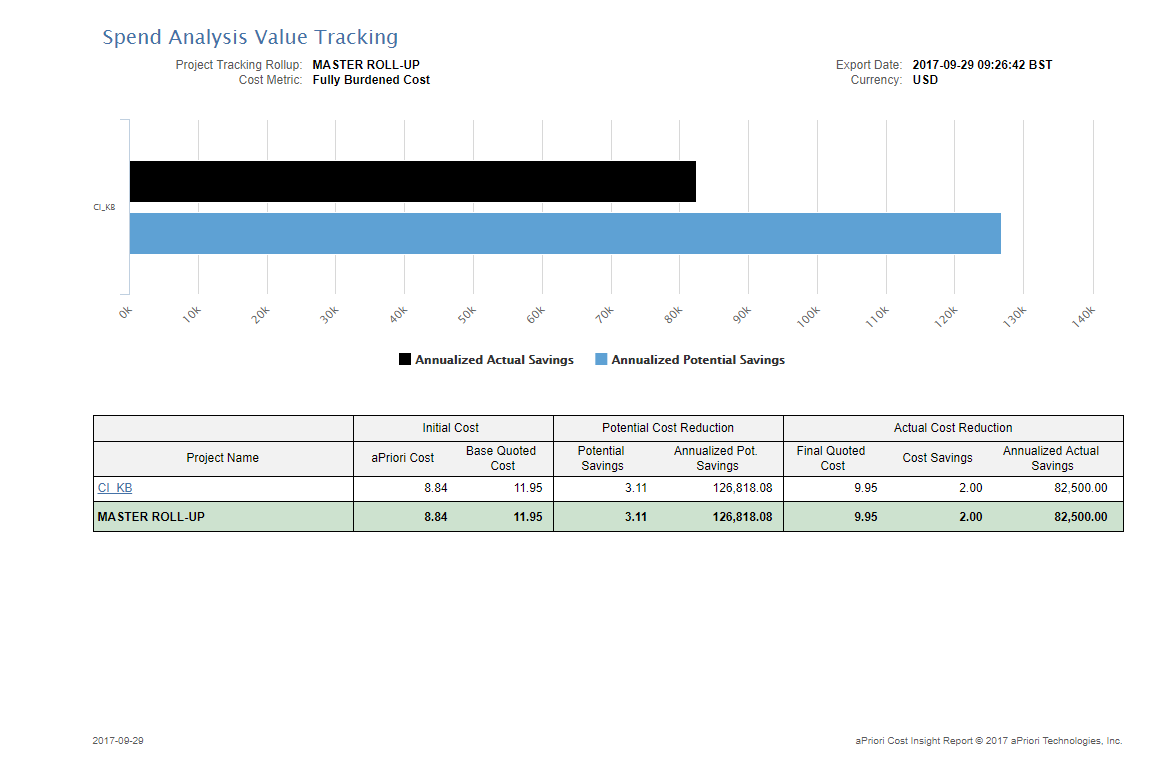
Expanding the report
The shown example the report displays a single project, CI_KB. Multiple projects can be added to the report by adding new project roll-ups to the value tracking roll-up. For example (in aP Pro):
![]()
If you then re-export this roll-up to aP Analytics, and re-run the report, you see the following report with three projects:
![]()
Report Features
There are a number of features to be aware of when reading the produced report, as outlined here:
![]()
- If a number has an asterisk beside it, it means that some of the components in the project-roll up are missing quotes.
- If a field is blank (denoted with a “-“) the project has only one component that can be compared and that component is missing a quote. In this example the project only has one component in the Final roll-up which is missing a quote.
- If a number is in a bracket and coloured red then it is a negative number. In this example the quoted cost is less than the aPriori cost the potential saving will be negative. Note, the cost savings are zero in this case.
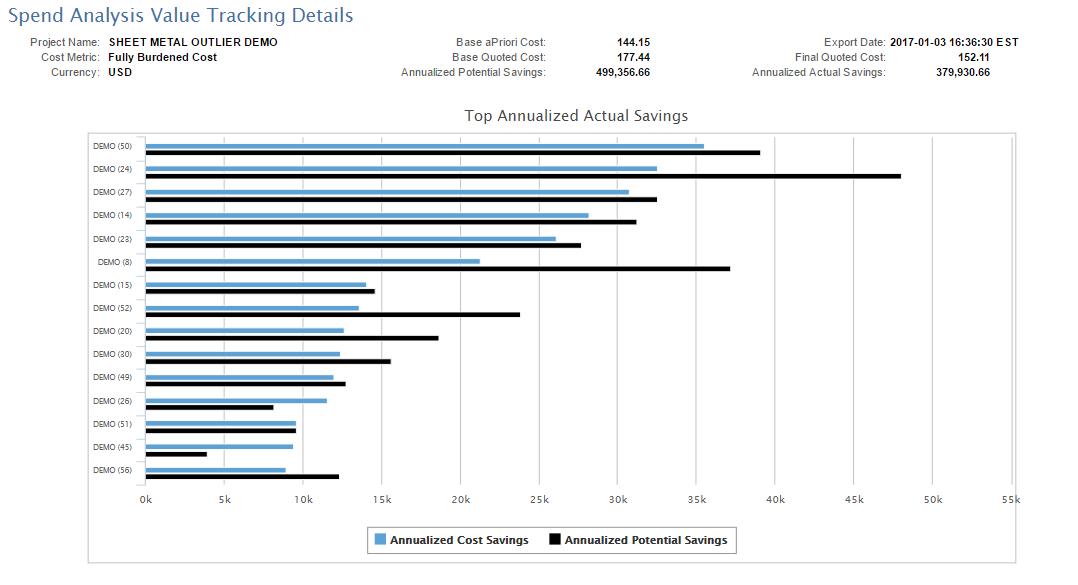
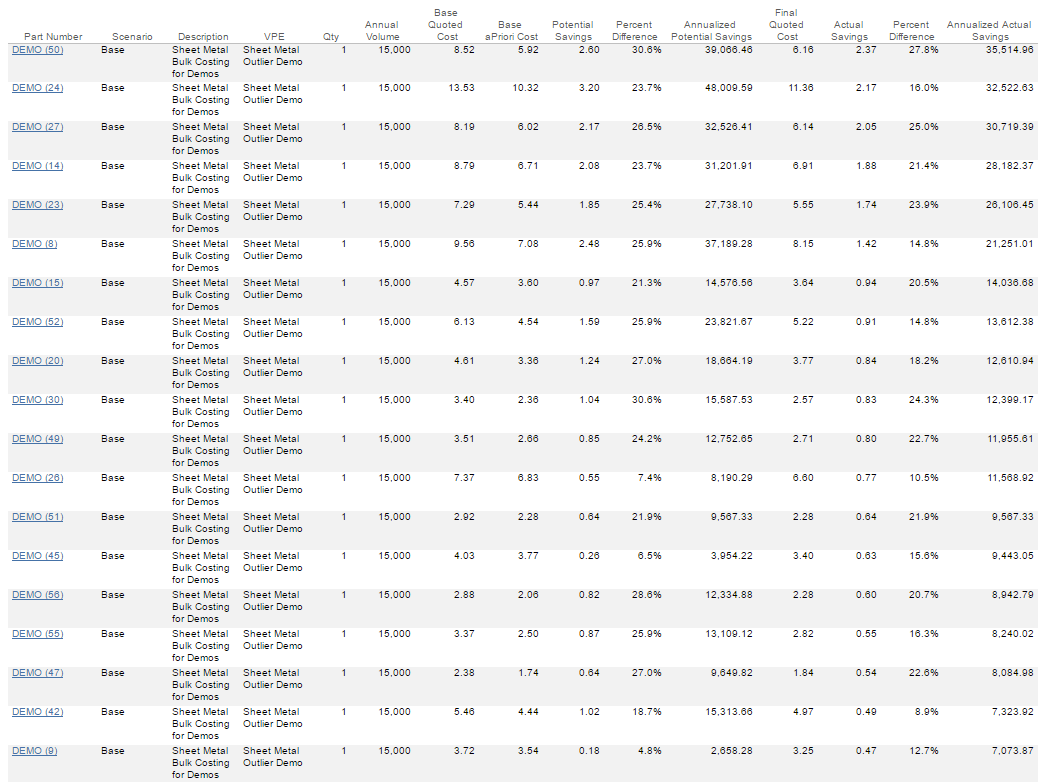
Spend Analysis Value Tracking Details