Quoting Reports
Info
See the Quoting Tutorials for specific examples of using Quoting Reports.
The Quoting reports (Digital Factory Performance and Digital Factory Performance Details) are geared towards aPriori users such as suppliers who must provide quick, accurate, and consistent quotes. These reports are intended to be used after three-to-six months of aPriori cost estimating activity, to determine how accurate the quotes have been and helping you to fine-tune Digital Factory data if necessary.
You can focus your analysis on fully burdened cost (FBC) or piece part cost (PPC), and measure these in the context of Digital Factories, process groups, processes, or materials.
These reports do not explicitly identify specific errors, but rather highlight areas of concern for further investigation based on statistical analysis. For example, they might help you identify issues such as:
- Laser cut quotes appear to be consistently under-estimated compared to the actual cost of manufacturing the parts.
- Quotes for stainless steel parts appear to be generally high, but many quotes come in low instead.
You can then look more closely at factors such as the laser cut machines you are choosing, or the logic associated with those machines, or the material costs of stainless steel in your Digital Factories. You can then adjust your Digital Factories as necessary to make your quotes more accurate.
The inputs for these reports require roll-ups containing quotes (which are represented as aPriori “should cost” estimates) and actual costs (which are stored in the Target Cost field of the “should cost” scenarios. There is no required naming convention for the roll-ups.
The input control for these reports prompts you to enter the following information:
| Field | Description |
|---|---|
| Earliest/Latest Export Date | Narrow down the time range of the Export Sets you want included in the report. |
| Export Set | Select the Export Sets you wish to use from those available from the time specified in the previous field. |
| Rollup | Use the drop-down menu to select the rollup you wish to use from those available from the Export Set(s) specified in the previous fields. |
| Export Date | Select the specific Export Set event that you wish to use for this report. |
| Cost Metric | Select Fully Burdened Cost or Piece Part Cost. |
| Performance Metric | Select from: Process Group Process Name Digital Factory Material Name |
| Minimum/Maximum Annual Volume | Narrow the parts considered in the report based on their annual volume. |
| Process Group | Select the process group(s) from the rollup that you wish to include in the report. |
| Process Name | Select the specific processes available in the selected Process Group that you wish to include in the report. |
| Material Name | Select the material available in the selected Process Group that you wish to include in the report. |
| Digital Factory Name | Select the Digital Factories used to cost the parts (given the above settings) that you want included in the report. |
| Currency Code | Select the Currency the report will use to display the results. |
Digital Factory Performance
The top-level Digital Factory Performance report presents information in a graphical format using a “box & whisker” chart:
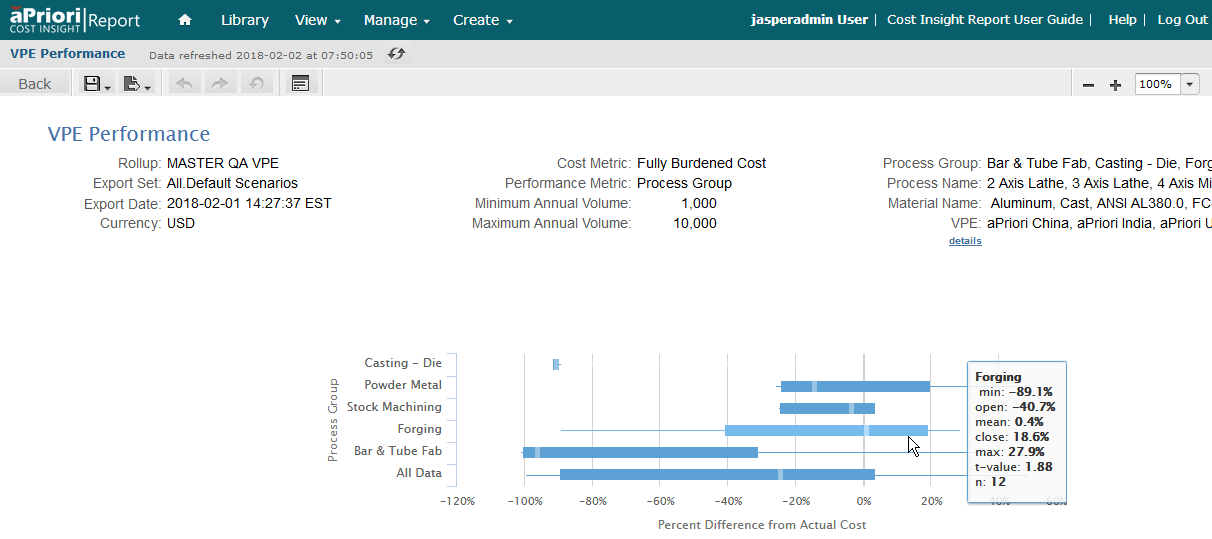
The top section just summarizes the choices you made in the input control. The lower, graphical section displays a standard “box and whisker” chart. (For illustrative purposes, the costs in the examples below are extremely inaccurate. Hopefully yours won’t be this far off!) Here’s a closer look:
The Y-axis at the left reflects the Performance Metric that you selected when running the report (Process Group in the example above). The whisker/boxes reflect the percentage difference between “should cost” estimates and actual costs over time. You can hover the cursor over a box to display details.
The chart plots the percentage difference between:
- Quote Estimate, the aPriori-calculated “should cost” value. This can be specified to be either Fully Burdened Cost (fbc) or Piece Part Cost (ppc) when the report is run. These scenarios represent the supplier quote being given to an OEM (manufacturer).
- Actual Cost, the manufacturing cost of the supplier as stored in aPriori’s Target Cost (tc) field.
We calculate “difference from target” as fbc – tc.
We then calculate “% difference” as ((fbc – tc)/tc) * 100
We do this for each scenario, and these calculations populate the box/whisker chart; depending on which y-axis metric is chosen. In the example above, the metric is “process group”. The set of scenarios is grouped into buckets where we see one whisker/box per bucket (Casting – Die, Powder Metal, etc.).
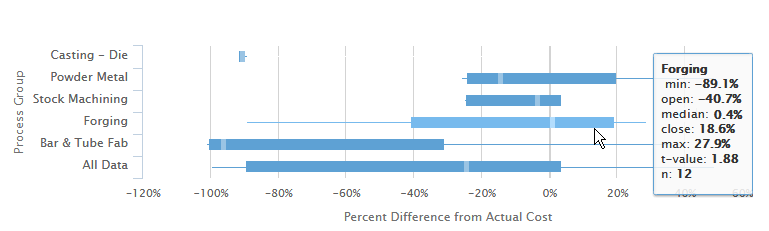
A whisker/box displays the following information:
The tool tip that is displayed when you hover your cursor over a box provides the following information:
- Min: Smallest observation; shown by the end of the thin blue line at the left of the box. [“Low value” in the illustration above.]
- Open: The left side of the blue rectangular box. [“25th percentile” in the illustration above.] This is the point above which 75% and below which 25% of the values reside.
- Median: Discrete median (% value) shown by the vertical white line in the blue rectangle. [“Median (a.k.a.50th percentile)” in the illustration above.] This is the center of the full set of values, which reveals the point above and below which 50% of the values reside.
- Close: The right side of the blue rectangular box. [“75th percentile” in the illustration above.] This is the point above which 25% and below which 75% of the values reside.
- Max: Largest observation; shown by the end of the thin blue line at the right of the box. [“High value” in the illustration above.]
- t-value: A “t statistic” metric that is used to sort the whisker charts (top to bottom). The t-stat measures where the population is “statistically significant” and the lower the absolute value is the more significant it is. So “1.7” and “-1.3” are both more significant than “1.9”.
- n: Sample size. The number of scenarios included in this whisker/box.
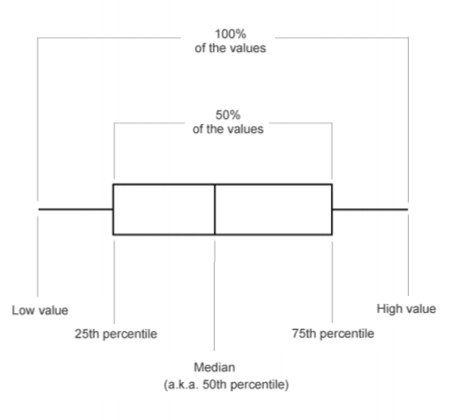
The range of the values from min (low value) to max (high value) is called the spread.
The range of the middle 50% of the values is called the midspread.
The middle 50% of the values lie in the blue box with the median line showing you the split (i.e. 25% of this 50% lie to the left of the median and 25% lie to the right of the median).
The lowest 25% of values are represented by the thin blue line to the left of the blue rectangle. The highest 25% of values are represented by the thin blue line to the right of the blue triangle.
Since the values represent percent difference of quote estimates and the actual costs, you can use the chart to see how close the population’s quote estimates are to the population’s actual costs. For example, the closer the white line is to the “0%” target line, the better your quote estimates match the actual costs. If the white line is right of the 0% target line, then your Digital Factory is typically overestimating the actual cost. If the white line is to the left of the target line, your Digital Factory is typically understating the actual cost.
The width of the blue rectangle also tells you about the spread of the differences. In general, the smaller the blue rectangle (i.e. less width) the less volatile your differences are. In other words, a very narrow blue rectangle tells you that your quote estimates are precise (if you are missing the target, at least you are missing consistently). A very wide blue rectangle, on the other hand, tells you that your quote estimates are all over the map. If you have a very wide rectangle where the median is right on 0%, your average may seem fine because everything evened up pretty well; but your quote estimates are not very precise and being close to the median can be random.
When the left and right sides of the blue rectangle are not equal, this tells you that your misses are skewed one way or the other. For example, a broader rectangle on the left side would mean that your quote estimates that are lower than actual costs have a wider spread of values than the quote estimates that are higher than actual costs.
The thin lines on the left and right end (the whiskers) represent the lowest 25% of values (where quote estimates are low relative to actual costs) and the highest 25% of values (where quote estimates are high relative to actual costs).
In summary, a narrow box with short whiskers indicates that your quote estimates are pretty precise. In addition, if your white line is close to the 0% target line then you are also pretty accurate. Being precise and accurate is the best situation. Preciseness without accuracy is not a bad second scenario because you can adjust for the shift (either left or right of the target line). If you are not precise, any accuracy (closeness to the target line) may be due to randomness in the population of parts.
In the above example, the costing results for the Bar & Tube Process Group appear to be both inconsistent and very low. To drill down on this area, you could re-run the report to focus on Bar & Tube and materials:
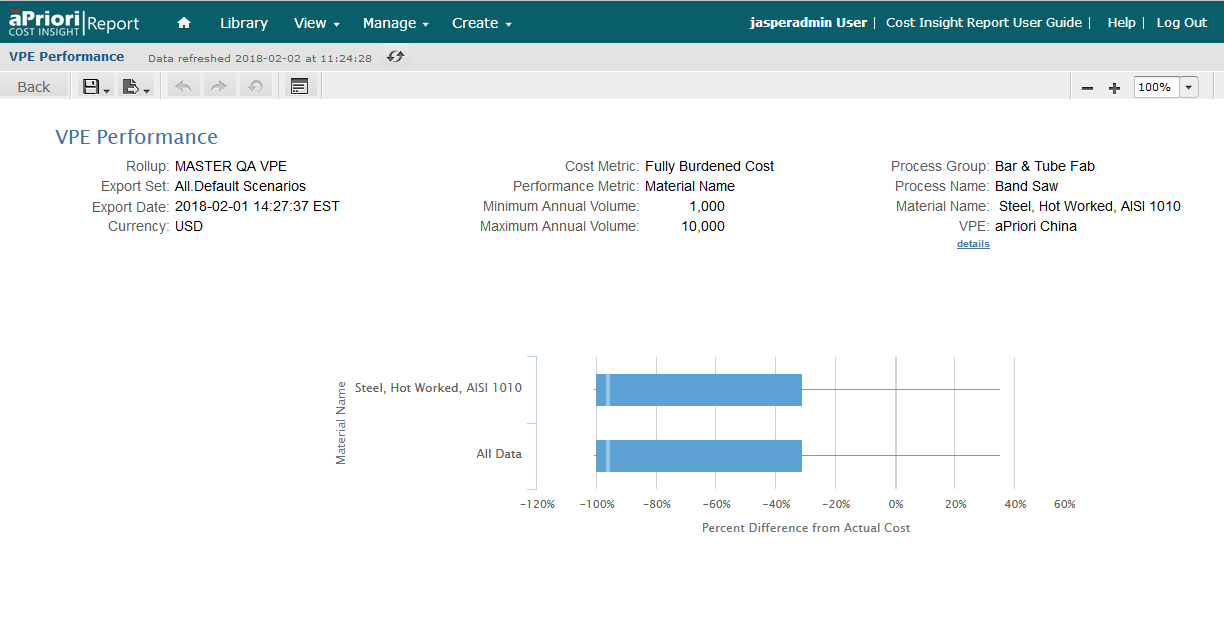
This report confirms that much of the problem with Bar & Tube Costing could be due to material costs. You could then proceed to investigate whether adjustments could be made to your Digital Factories or Regional Data Libraries to increase costing accuracy.
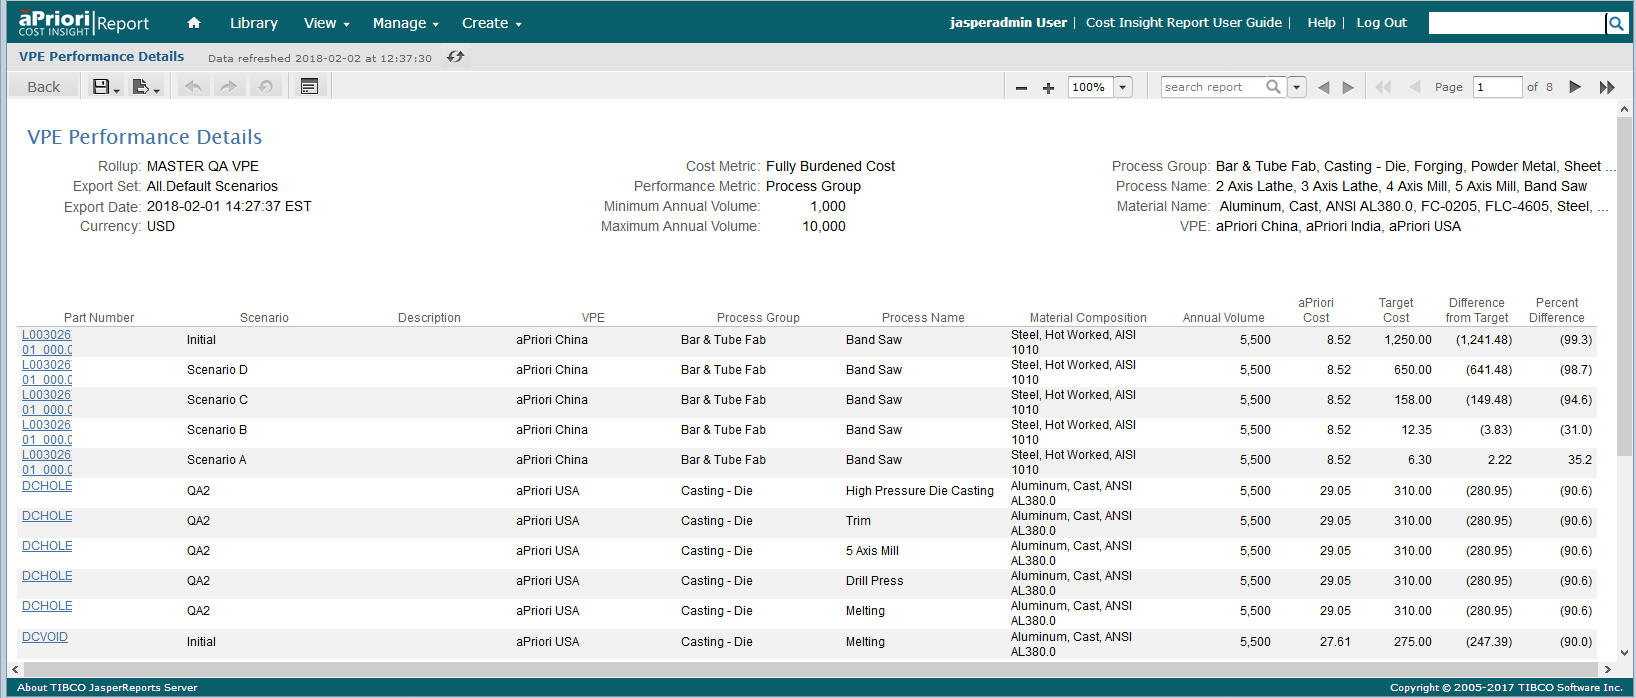
Digital Factory Performance Details
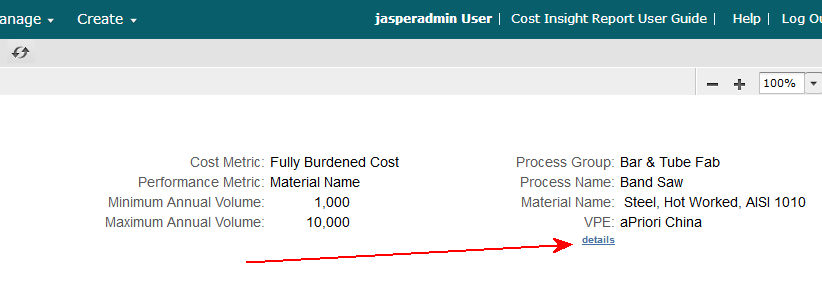
You can click the details link in the upper-right of any Digital Factory Performance report to display its related Digital Factory Performance Details report:
The Digital Factory Performance Details report displays data in a tabular format similar to the Part Details tab in aP Pro.