Ad Hoc Support for DTC Metrics
Ad Hoc report writers have access to aPriori Design to Cost (DTC) metrics.
Examples of how this DTC data can be used are provided in the Out-of-Box DTC Machining reports, as described in the Guide to Using OOB Reports. This section provides an overview of the DTC Metric data and how it is structured in the Ad Hoc domain. The database table structure for DTC Metrics is described in the aP Analytics Schema Model Spreadsheet, which is available in the on-line help. A summary of available DTC metrics is provided in Appendix B: DTC Metrics Summary.
DTC Metrics
aP Analytics supports a variety of metrics for specific process groups. These process groups include:
| Process Group Areas | Supported Process Groups |
|---|---|
| Machining | Stock Machining, 2-Model Machining |
| Casting | Casting - Die, Casting - Sand |
| Plastics | Plastic Molding |
| Sheet Metal | Sheet Metal |
Within each Process Group area there are different categories of DTC Metrics:
| Category | Machining | Casting | Plastics | Sheet Metal |
|---|---|---|---|---|
| GCD Counts | X | X | X | X |
| Manufacturing issues | X | X | X | X |
| Tooling | X | X | ||
| Secondary Machining | X | X | ||
| Tolerances | X | X | X | |
| Slow Operations | X | X | ||
| Design Standards | X | X | X |
Note:
Process groups may not have metrics for all of the categories. The “X” in the above table shows the categories that are relevant for each process group.
Finally, there are three distinct metric types:
Count: Numbers of things such as holes, hole sizes, setups, etc.
Ratio: A ratio of two other metrics such as “Hole Sizes / Holes” which represents the ratio of the number of holes sizes compared with the number of holes.
Time: this is the number of seconds that an operation takes, such as the Machining Cycle time or the Contouring Operations time.
For a complete list of all of the DTC Metrics, placed in their respective Process Groups and Categories, see Appendix B: DTC Metrics Summary.
Two domain views for DTC Metrics
There are two different views provided in the Ad Hoc domain for accessing DTC Metrics:
- A view (typically displayed as a table) showing all the DTC Metrics for a single part or group of parts.
- A view to display specific DTC Metric values for a single part or group of parts. For example, you might produce a bar chart that shows the count of Manufacturing Issues for specific parts.
The following sections provide examples of each of these views. These examples assume a general familiarity with build Ad Hoc reports. For a basic introduction to Ad Hoc report generation, see Ad Hoc-Report-Example earlier in this chapter.
View 1 Example: List all of the DTC Metrics for a Part
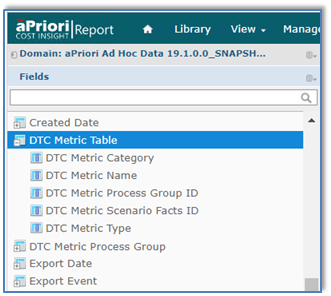
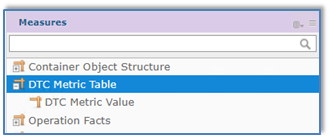
This example builds a Table report that shows each DTC Metric, along with its Category, Type and Value. To do this we are going to use the DTC Metric Table list in the Ad Hoc view. This list maps the dtc_metric table from the reporting database. Each DTC record is linked to the Scenario Facts record using the Scenario Facts ID field. Most of the values for a DTC Metric are located in the “Fields” section of the ad hoc view. Only the metric “Value” is located in the “Measures” section as shown in the screen shots below.
The fields we want to include in the Ad Hoc view include:
- Scenario Part Number: from the Scenario list
- Process Group Name: from the DTC Metric Process Group list
- DTC Metric Category: from the DTC Metric Table list
- DTC Metric Type: from the DTC Metric Table list
- DTC Metric Name: from the DTC Metric Table list
- DTC Metric Value: from the DTC Metric Table list (in the Measures area)
The Part Number is placed in the “Groups” row so that this report will work well if you want to display more than one part number in the report.
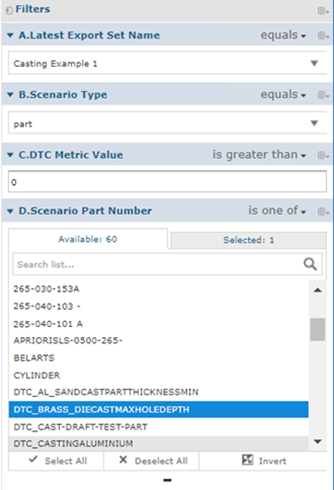
There are several filters as well:
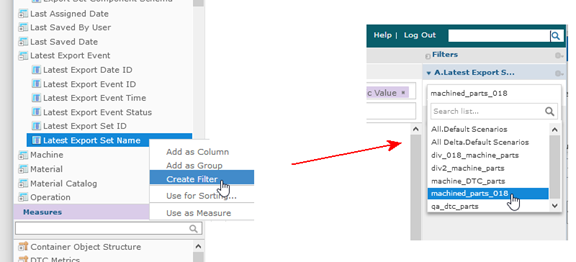
- A: Latest Export Set: this filter selects the export set to use.
- B: Scenario Type: this filter selects “parts” (ignores “assemblies” or “rollups” that might be in the export set).
- C: DTC Metric Value: the ad hoc view will only show metrics that are greater than zero. If you want to see all metrics you could remove this filter.
- D: Scenario Part Number: this filter controls which part numbers will be displayed in the ad hoc view.
Reminder: To create a filter, find the field or measure on the left, then right-click and select Create Filter. The filter appears on the right side of the screen, where you can select the value to filter by.
The end result should appear similar to the following, but showing your own data. Close-ups of various portions of the view are shown below.
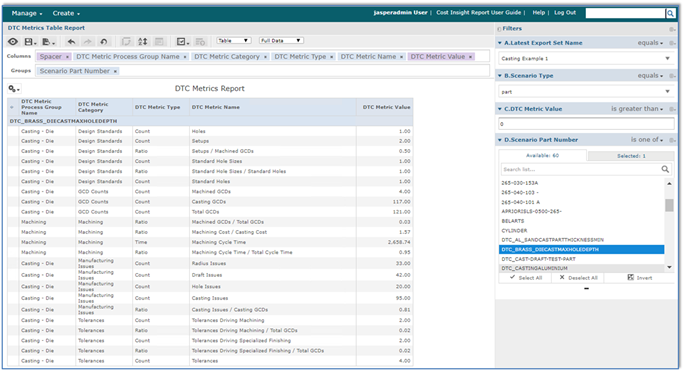
Columns and Groups close-up

Filters close-up
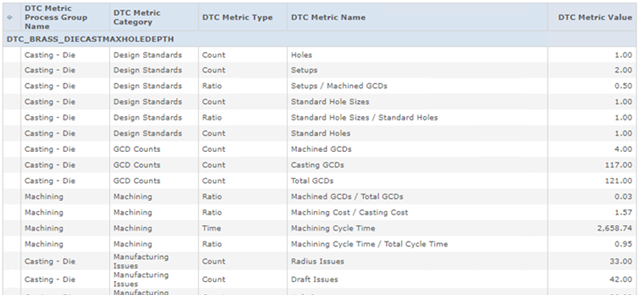
Results close-up:
View 2 Example: Chart that aggregates DTC Metric Values for a set of Parts
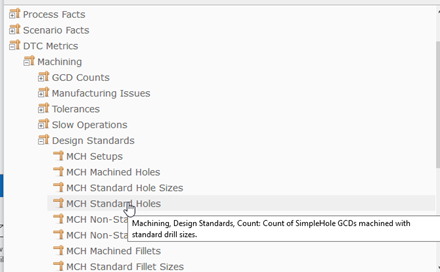
If you want to create an ad hoc view that charts different metric values within an ad hoc view you will want to use the DTC Metric Values lists. The following examples use metrics taken from the Design Standards list under the Machining process group. Note: Bar chart colors and other details may vary in your version of aP Analytics.
The columns and groups are set up like this:

The filters are configured like this:
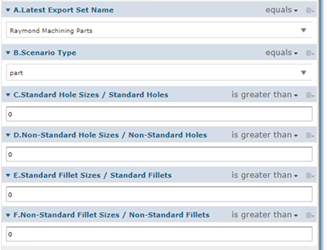
The first chart shows four design standards ratios for a collection of machined parts.

This ad hoc view is using a stacked bar chart to show how each part rates in terms of minimizing the number of different sizes of standard/non-standard holes, and of standard/non-standard fillets. In general, a smaller ratio is better than a 1:1 ratio which would mean you only have one part per hole or fillet size. This bar chart provides a quick glance at parts that you might want to take a closer look at.
You might also want to know what the number of hole and fillets are for each part to get a better handle on the magnitude of the issues you may be dealing with. You could create the following ad hoc view and also place the two reports into a dashboard to compare them side by side.

To create ad hoc views that chart different metrics, use the DTC Metrics lists in the “Measures” area. The DTC Metrics list is organized by process group and then by category. Note that tooltips provide detailed information about each metric.