Notes Common to Several Reports
The following notes apply to some or all of the available Out of Box Reports:
Ad Blockers and Hanging Reports
If your browser has an “ad blocker” extension, it can cause Out of Box reports to hang before they completely display. If you see this behavior, try turning off the ad blocker or switching to another browser.
“Crosstab bucket” Error
When running crosstab reports such as the Material Activity report (part of the Scenario Activity Report), you might encounter the following error message:
Crosstab bucket/measure limit (100,000) exceeded.
This error is due to a JasperReports Server limit that is set by default to 100K. Although it is possible to change this limit, doing so can have negative side-effects. Instead, aPriori recommends working around the issue by adjusting the input values of the reports: for example, reduce the number of time periods by setting a large trend period (weeks instead of days, months instead of weeks), or set a shorter interval (start/end dates).
Single Database Flavors
aP Analytics can only generate reports from a single database flavor. If you have multiple database types in your configuration (for example, MySQL and Oracle) and try to run, for example, the User Activity Reports, you will see an error similar to:
There was an error on the server. Try again or contact site administrators. Error UID fd90a683-b6a8-4c51-8984-890d707dcbe1
Null Quoted Costs
Null quoted costs (situations where “quoted cost” values have not been provided by a user) are represented in reports by a dash and are not included in calculations. (In earlier releases, null quoted costs were represented as “0” and were included in calculations.)
Very Large Numbers in Reports
If a calculation results in a huge, unrealistic value, that value will be shown as a red exclamation mark.
For example, the Component Cost Report calculates lifetime cost as annual_volume * production_life * aggr_fbc. The value of aggr_fbc is sometimes set to the special constant “1E125”, which can lead to an overflow result when used in this calculation. To avoid this, aPriori checks to see if aggr_fbc is set to “1E125”, and if it is, does not calculate the lifetime cost and instead display the red exclamation mark.
Saved Inputs Menus
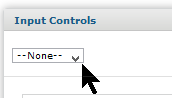
The input control dialog boxes for many reports provide the ability to save copies of the dialog box populated with values. This capability allows you to quickly reuse common values. However, the purpose of the saved inputs drop-down menu may not be obvious the first time you see it. Jasper implements this as an unlabeled menu with a default value of “—None—“.
To display all versions of the dialog box that you have saved and to choose a version for the current window, expand the dropdown menu.
Currency Code Menu
Many OOB reports provide a “Currency Code” menu that allows you to manually change the currency display.
Using the Input Controls for DTC and Comparison Reports
Many Out of Box reports are designed to cover three common use cases.
- Use Case #1: aP Analytics is configured to run an ALL scenario export set, perhaps once a week, along with an ALL DELTA export set which runs daily. When running OOB reports you want to select the latest versions of all scenarios, which includes the last ALL export along with any subsequent ALL DELTA exports, but only one instance of each scenario. (For more information about these export sets see the section “All vs All Delta exports” in the aP Admin: User Guide.)
- Use Case #2: aP Analytics is configured to export a specific export set that you are interested in—for example, just Stock Machining parts. It may also be configured to export all scenarios as described above, but you want to only see scenarios from the latest export event for a specific export set.
- Use Case #3: You want to show how scenarios change over a specific time period. You want to select an export set (it could be any of the sets described in the other two use cases) and access all export events for this export set within that time period.
OOB reports include three Input Control fields that you must coordinate if you are addressing one of the three common use cases. This section explains how to configure for the Input Control fields for two OOB reports that cover the three common use cases:
To achieve the results you want, you must coordinate the values you enter in the following Input Controls fields:
- Use Latest Export?
- Export Set
- Earliest/Latest Export Date
For each of the use cases described above, set these fields as described below:
- Use Case #1 (latest version, all scenarios):
- Use Latest Export? -- Select All
- Export Set -- Select the name of the ALL export set. Note: If you have access to more than one component schema, you might see more than one ALL export set.
- Earliest/Latest Export Date: Set the dates to capture just the All export set for which you want to generate a report. This will typically be within the recent past, to capture the most recent data. However, you could also target an earlier time period, such as a previous quarter.
- Use Case #2 (latest version, specific scenarios):
- Use Latest Export? -- Select Scenario.
- Export Set -- Select the name of the desired export set(s).
- Earliest/Latest Export Date: Set the dates to capture just the specific export set(s) for which you want to generate a report. This will typically be within the recent past, to capture the most recent data. However, you could also target an earlier time period, such as a previous quarter.
- Use Case #3 (multiple versions for trend reports):
- Use Latest Export? -- Select No.
- Export Set -- Select the name of the desired export set(s).
- Earliest/Latest Export Date: Set the start and end dates of the period for which you want to report trends.
The Earliest/Latest Export Date input control allows you to specify a date range that alters the collection of export events that apply to the use cases. For example, you might want a trending report to select scenarios from a specific time interval. You could also use these input controls to report on All scenarios but see the latest ones from an earlier time period, such as a previous year or quarter.