Economic Updates
Regional Database Libraries Release Notes 2022-10
Exchange Rates
Since the Regional Data Libraries 2022-07 release, most currencies have decreased in value. Inflation continues to soar around the world and central banks have doubled down on increasing interest rates to rein it in. The US Fed increased rates again in November, pushing the federal fund rate range to rates not seen since 2008. These rate hikes have pushed the value of the US dollar higher and higher through increases in foreign investment opportunities. US interest rates are forecast to continue to rise in 2023.
One of the few currencies who have emerged above the rise of the USD is the Peso. The Bank of Mexico acted swiftly to tame inflation and increased interest rates in March of 2021, a year before rise in US rates. Additionally, due to the war in Ukraine the EU announced a ban on seaborne Russian oil imports by the end of 2022, this increasing market share to oil rich countries around the globe such as Mexico. These factors, along with increased foreign investment as a consequence of global supply chain woes from the COVID-19 pandemic, have driven the currency to pre-pandemic exchange rates between the USD and other currencies.
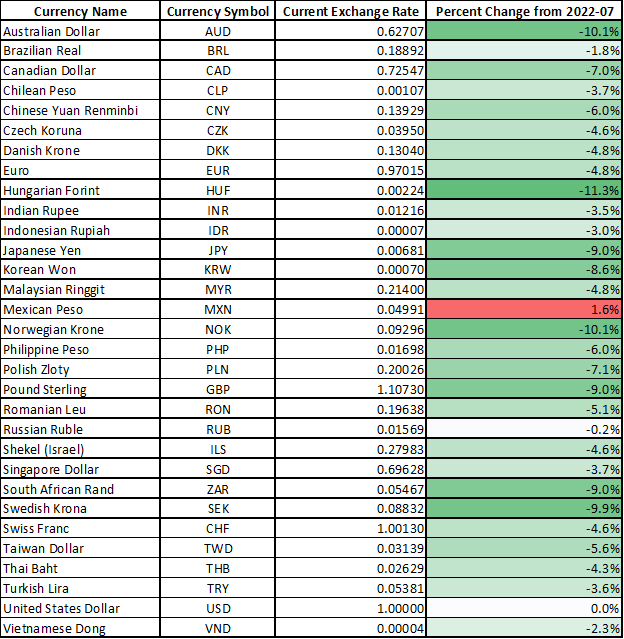
This table shows the current exchange rate and the percent change in exchange rate between the USD and other currencies.
Labor Rates
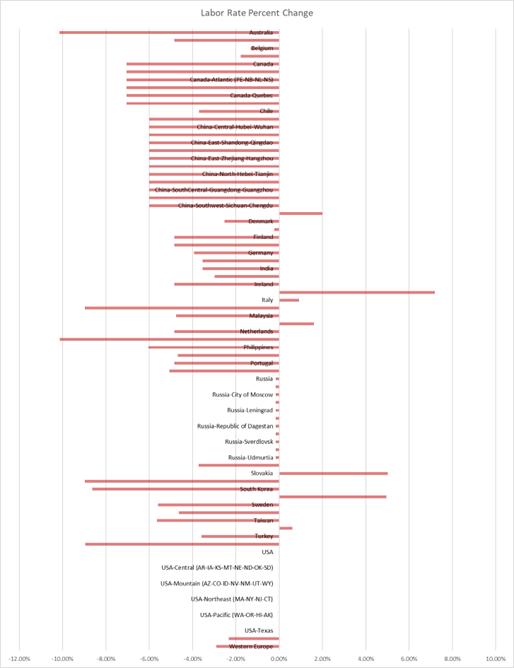
This chart shows Labor Rate changes relative to the 2022-07 Regional Data Libraries release. Most labor rates around the world have decreased due to currency devaluation relative to the United States Dollar similarly to our last release.
Total Manufacturing Rates
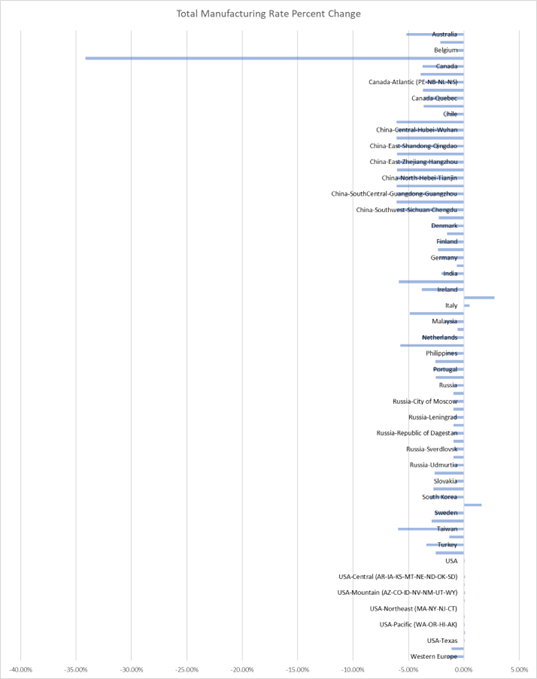
This chart shows changes in Total Manufacturing Rates (Labor + Direct and Indirect Overhead) relative to the 2022-07 Regional Data Libraries release. Rates in large have decreased slightly relative to our last release. The largest change seen in the graph below is in Brazil, where aPriori has updated the imputed interest rate resource to reflect current rates. Imputed interest rates have a large effect on direct overhead rates and therefore, should be updated accordingly for accurate estimates.
This chart shows the percent change in total manufacturing rate for each region in the Regional Data Libraries 2022-10 release.
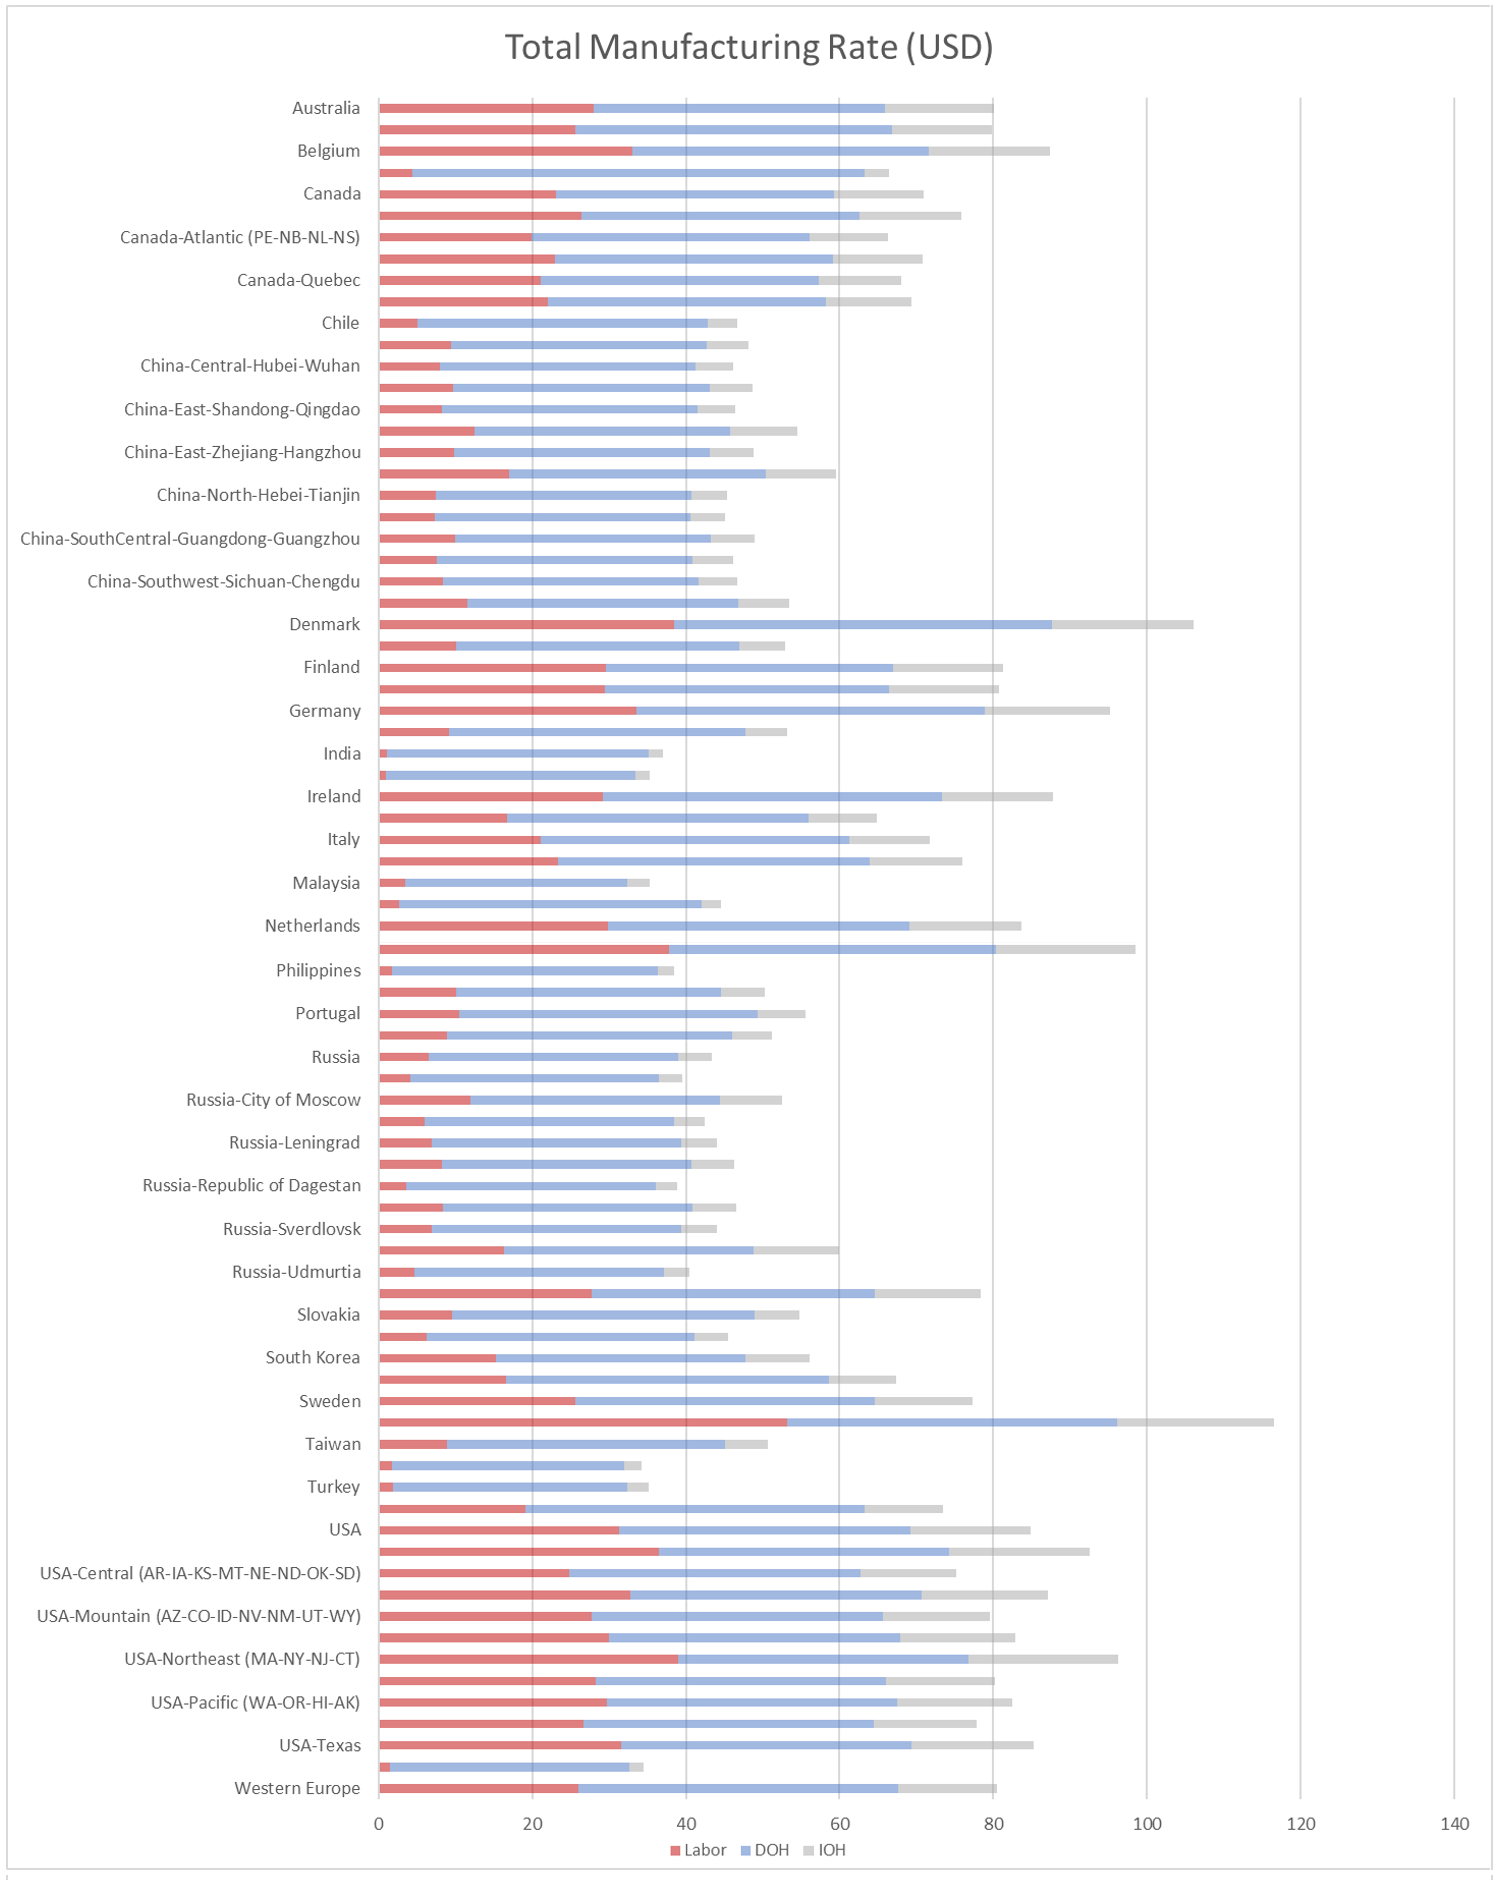
This chart represents the average total manufacturing rate for each region in the Regional Data Libraries 2022-10 release.
Material Rates
The material rate changes in the 2022-10 release of the Regional Data Libraries represent fluctuations in the materials markets. There were no material price assumption changes in this release.
World economic uncertainty has continued in our latest economic update. Recession fears are still looming around the globe and strict COVID-19 lock downs in China have remained, pushing down prices of ferrous and non-ferrous metals. Central banks have repeatedly raised interest to stifle inflation, and roaring energy prices are hurting producers and consumers alike. These bleak economic indicators provide a bearish forecast for the months ahead.
Plastic prices remain on the decline. ABS and nylon saw increases in supply and reduced demand, furthering devaluation. Gasoline production and low demand has continued to affect the prices of polypropylene, polystyrene, and polyethylene. Gas prices have decreased causing a reduction in the price of benzene, polystyrene’s feedstock, which in-turn reduces the price of polystyrene. Polyethylene and polypropylene prices have further declined with high supply and low demand. To increase the price of the resin, polyethylene producers have started to reduce production.
This table shows the percent change in material rates relative to the 2022-07 Regional Data Libraries.
| Non-Ferrous | Non-Ferrous | Ferrous Metals | Ferrous Metals | Plastics | Plastics |
|---|---|---|---|---|---|
| Aluminum | -13.8% | Ductile Iron | -12.9% | ABS | -7.6% |
| Aluminum Bronze | -14.6% | Galvanized Steel | -13.0% | Nylon | -2.2% |
| Brass | -15.2% | Low-Alloy Steel | -12.6% | Polycarbonate | -1.6% |
| Bronze | -15.2% | Malleable Cast Iron | -12.4% | Polyethylene | -11.4% |
| Copper | -11.5% | Stainless Steel | -10.4% | Polypropylene | -14.7% |
| Gray Iron | -13.1% | Steel | -12.3% | Polystyrene | -8.3% |
| Heat Resistant Super Alloys | -10% | Unalloyed Steel | -12.8% | ||
| Magnesium | -12.6% | ||||
| Titanium | -3.4% | ||||
| Zinc | -14.8% | ||||
| Zinc-Aluminum | -14.8% |