Bulk Costing Usage Reports
System administrators can run a Bulk Costing Usage Report to help analyze how Bulk Costing and Analysis is being used within your organization; showing user login and costing event activity, both from the UI and run from the command line.
The report also includes the total number of cost events generated through both aP Pro generally and from the Bulk Costing & Analysis module.
Info:
Other user activity reports are available from aP Analytics - see aP Analytics User Guide.
Run the Usage Report
The Bulk Costing Usage Report is run as a line script, from the <aP_install>\bin installation directory.
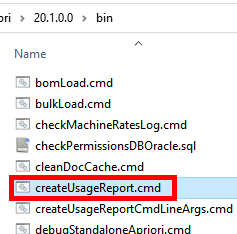
You can run:
createUsageReport.cmd: an editable version that you run manually.createUsageReportCmdLineArgs.cmd: a read-only version run from another script or as a scheduled task which passes in arguments at run-time.
By default, these scripts create reports in <aP_install>\UsageReports.
Passing command-line Arguments
The following settings are configured to accept command line arguments in createUsageReportCmdLineArgs.cmd
set startDate=%1set endDate=%2set onlyRecordsAfterLastReport=%3set usageReportPath=%~f4
Configure and Run createUsageReport.cmd
- Navigate to
<aP_install>\bin - Open
createUsageReport.cmdin a text editor. - To run the Usage Report for a specified timeframe, set
startDateandendDatevalues in the formMM/DD/YYYYand setonlyRecordsAfterLastReportto false. - To run the Usage Report for costing activity since the time the report was generated, leave
startDateandendDateblank and setonlyRecordsAfterLastReportto true. - Save the file when done.
- Double-click
createUsageReport``.cmdto run the report. -
The resulting report is created and saved by default in
<aP_install>\UsageReports, as a text file: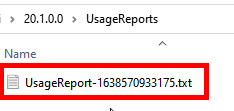
You can specify a different target by editing
usageReportPathin the.cmdfile.
View the Report
Open the report file located in <aP_install>\UsageReports to view license information and usage data presented with the following columns.
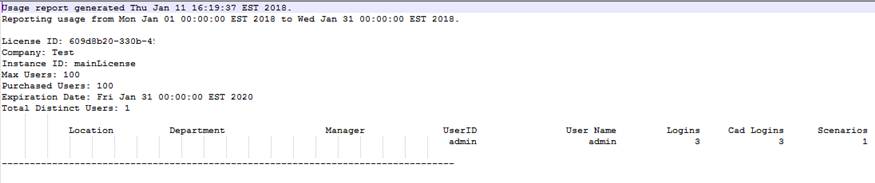
Where fields are as follows:
| Column | Column | Description |
|---|---|---|
| UserID | The login of each user that logged in during the time period. | |
| Location | A property of the user, defined in the system administration toolset. | |
| Department | A property of the user, defined in the system administration toolset. | |
| Manager | A property of the user, defined in the system administration toolset. | |
| User Name | A property of the user, defined in the system administration toolset. | |
| Logins | The number of times the user logged in during the time period. | |
| CAD Logins | The number of times the user logged in to aPriori through either ProE or CAD-I integration modes excluding logins that happen during bulk/deep cost operations. | |
| Scenarios | A property of the user, defined in the system administration toolset. | |
| Cost Events | The number of times the user costed a scenario during the time period plus the number of Bulk Cost Events. | |
| Bulk Cost Events | The number of times the user completed a bulk costing event. | |
| Time Logged In | The total time that the user spend logged in during the time period. This is formatted as "Days Hours:Minutes:Seconds". | |
| Last Logout Time | The last date and time that the user logged out of aPriori. |
Note:
The report is split into sections based on the license types (sub licenses) you have. If you only have one license type, there is only one section.
Note:
For the Cost Events and Bulk Cost Events items noted above, the final count of these events will not be saved until you exit aP Pro. For example, if you bulk cost 24 parts and immediately run a usage report, you might see only 20 bulk cost events recorded. If you exit aPriori and then rerun the report, you will see all 24 bulk cost events reported.