Identify manufacturing location with lowest carbon and lowest cost
This example shows how to compare the cost and carbon impact of manufacturing a part in two different locations. This is useful for deciding where to manufacture a part.
This example demonstrates a comparison of the cost and sustainability data for the manufacture of an identical part (same design, same Cost Guide options) in two different locations (USA and Eastern Europe).
If you have your own customized Digital Factories in aP Pro, you can compare between, for example, your own different manufacturing facilities.
For more information about comparing parts, see Compare Scenarios and Creating and editing comparison summary views.
Requirements
To enter and analyze sustainability data, you must have an aPriori Sustainability License and aP Pro 2023 R1 or later.
Limitations
- aP Pro does not yet support Sustainability analysis for all process groups. For a list of currently supported process groups, see Processes supported in Sustainability.
- Carbon from product use, tooling, and end-of-life is not currently considered.
Prerequisites
This example requires at least two different scenarios for the same part. Each scenario must:
- Use a process group that is supported for Sustainability.
- Be costed in a version of aP Pro that includes a Sustainability License.
Procedure
Create two scenarios
- Import a part into aP Pro (See Analyze Components with the Cost Guide).
- To create the first scenario, in Cost Guide > Production Scenario, select Digital Factory: aPriori USA.
- Select other options as required in the Cost Guide window.
-
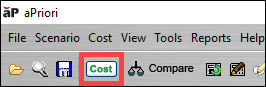
Cost the part: in the aP Pro menu bar, click the Cost button.
-
Press F12 to save the scenario (or select Scenario > Save As > Scenario). Use scenario name: 2023-example-USA.
- To create the other scenario, in Cost Guide > Production Scenario, select Digital Factory: aPriori Eastern Europe.
- Cost the part: in the aP Pro menu bar,click the Cost button.
-
Press F12 to save the scenario (or select Scenario > Save As > Scenario). Use scenario name: 2023-example-EasternEurope.
Compare the two scenarios
-
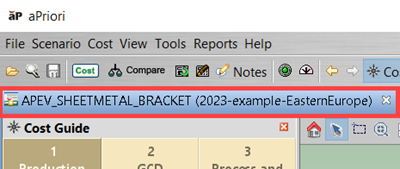
Click the 2023-example-EasternEurope scenario tab.
-
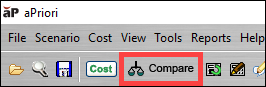
In the aP Pro menu bar, click Compare.
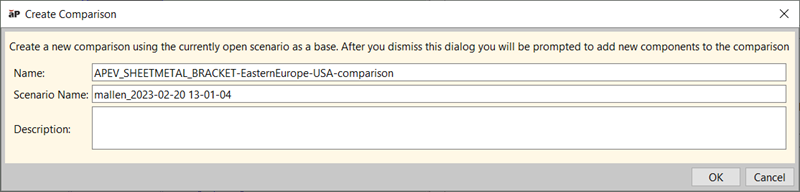
The Create Comparison dialog opens.
-
Optionally, in the Create Comparison dialog you can edit or include a:
-
Name – By default, this field contains the name of the component, followed by "-comparison".
-
Scenario Name – By default, this field contains your user name and the date and local time that you created the comparison.
-
Description – It is typically useful to enter a short description for the comparison.
-
To continue, click OK.
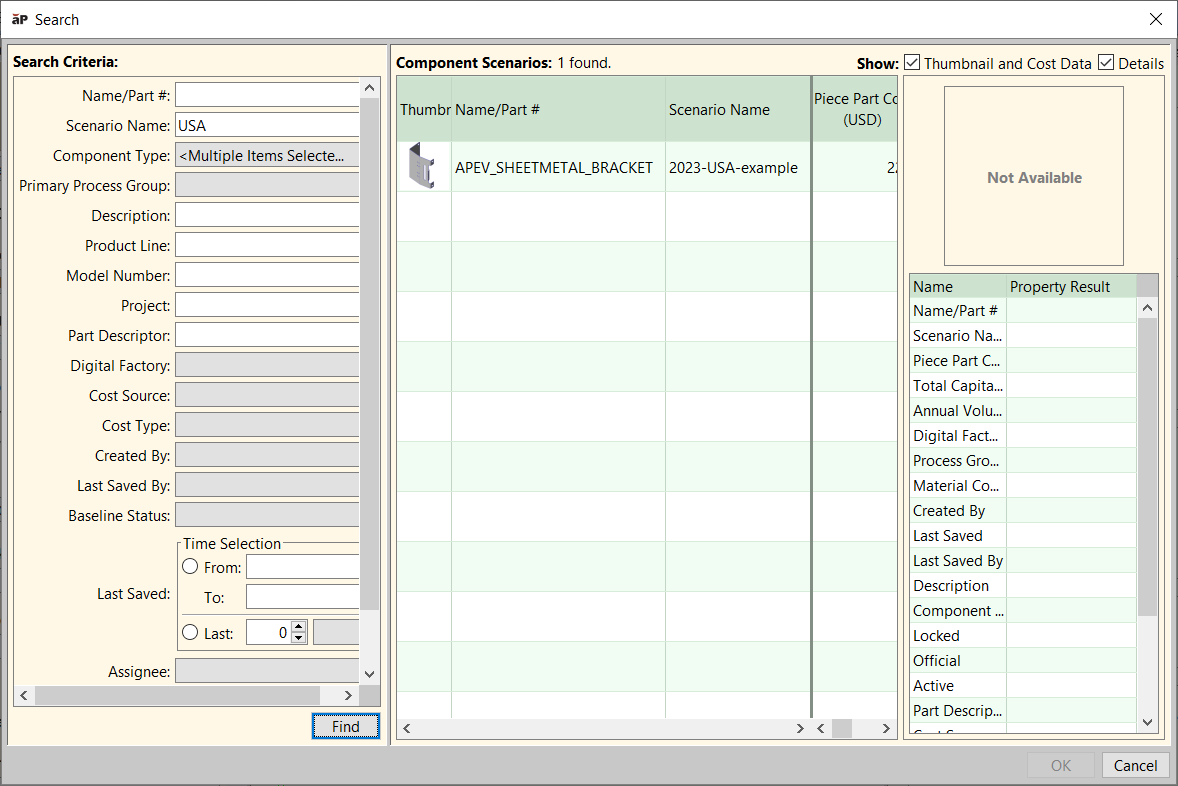
The Search dialog opens.
-
-
In the Search dialog, in the Search Criteria pane, in the Name/Part# field, enter USA and then click Find.
-
In the Component Scenario pane, select the 2023-USA-example scenario and then click OK.
Tip:
You can select more than one scenario, for a comparison.
-
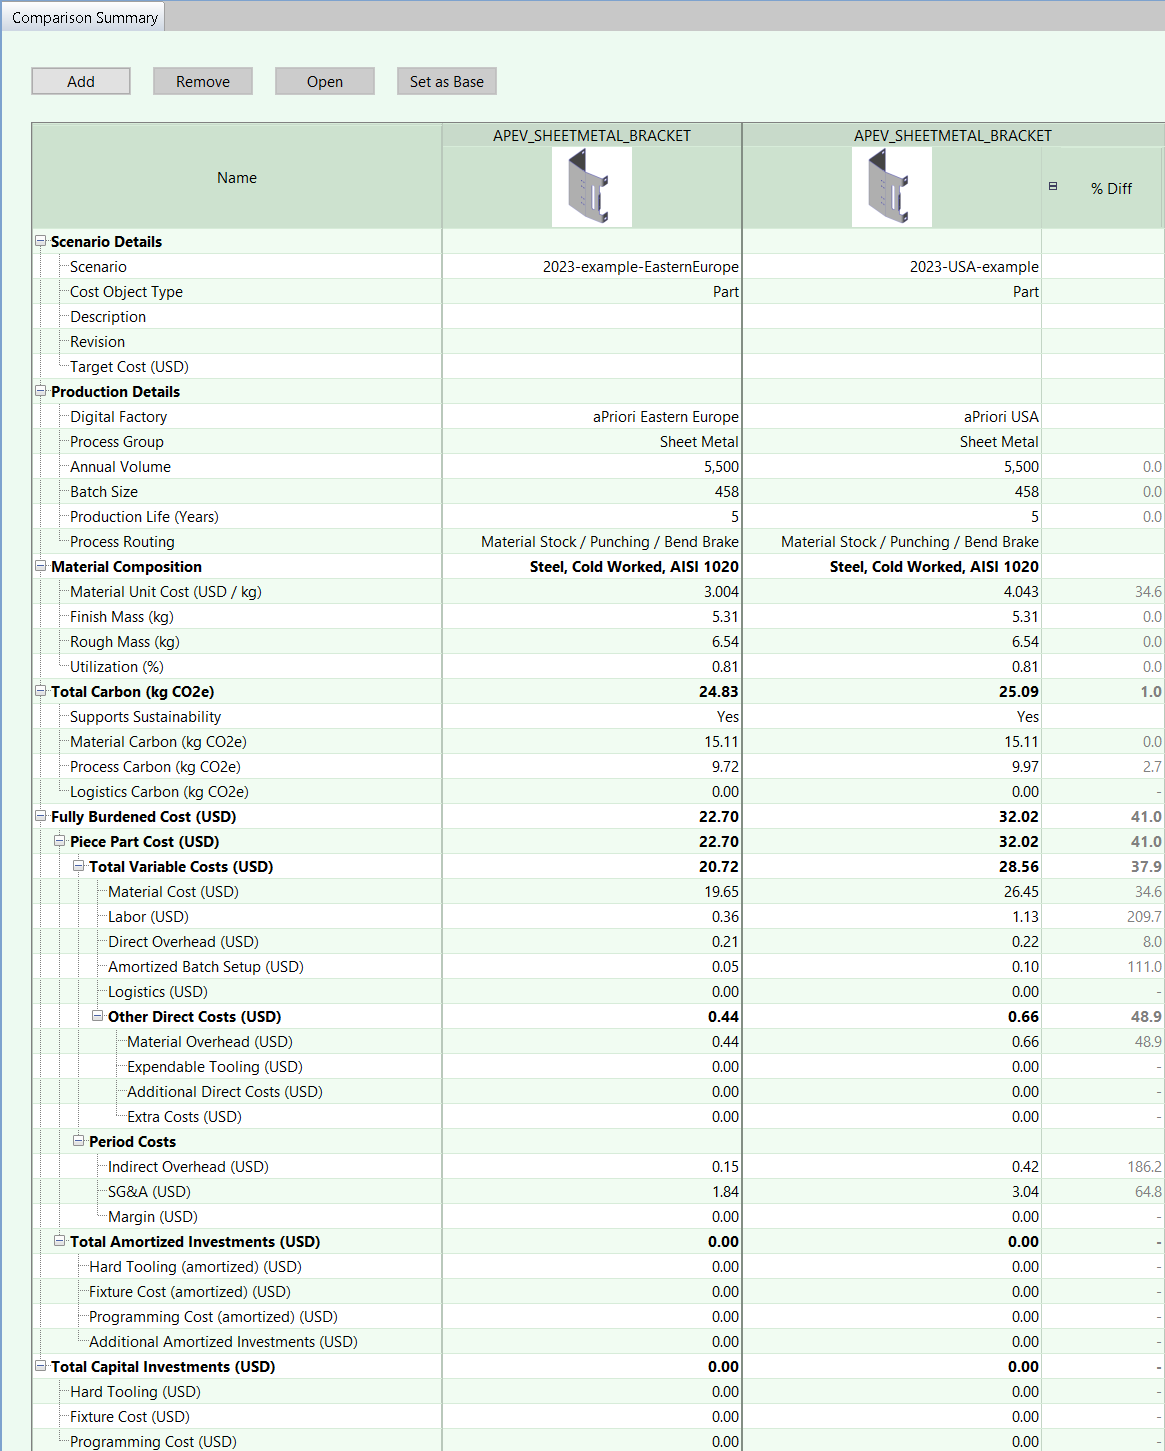
The Comparison Summary opens.
To focus on a particular set of data, in the first column of the Comparison Summary, close the nodes for other types of output. For this example, to focus on the cost and sustainability data, which is in the Total Carbon (kg CO2e), Fully Burdened Cost, and Total Capital Investment nodes, the node for Material Consumption is closed.
Info:
The scenario in the second column on the left is the base (or reference) scenario column. The data for all other scenarios is compared to the data for the base scenario column and the difference in values is displayed as a percentage in the % Diff column for each non-base scenario. To change the base scenario, drag and drop the column for that scenario to the base scenario column, or select the scenario you wish to be the base scenario and click the Set as Base button.
Tip:
To add additional scenarios to the comparison, click the Add button.
Note:
The unit that is displayed in the sustainability fields depend on the selected unit for Mass in your Unit System Settings.
For information about the cost data, see Cost Summary Tab. The sustainability data is included in the Total Carbon (kg CO2e) node. Total Carbon (kg CO2e) is the total carbon emissions for a single part, which is the mathematical sum of material, process, and logistics carbons for the part. Supports Sustainability indicates whether the process group that is selected for the scenario is supported for sustainability. The possible values are:
-
Yes: aPriori Sustainability has carbon data for the materials and processes used.
-
Partial: aPriori Sustainability has carbon data for some of the materials and processes used. This means that the routing includes a mix of supported and unsupported processes.
-
No: aPriori Sustainability has no carbon data for the materials and processes used.
Material Carbon (kg CO2e) is the mass of the CO2 equivalent that is attributed to the raw materials of the part, that is, the carbon associated with the primary material rough mass and secondary materials (for example, paint) consumed during the manufacturing of the part.
Process Carbon (kg CO2e) is the mass of the CO2 equivalent that is attributed to the processes used to manufacture a part. Process Carbon includes the electricity and other energy sources used to turn the rough mass into the finished component.
Logistics Carbon (kg CO2e) is the mass of the CO2 equivalent that is attributed to the processes used to transport the part, including any processes that are used during transportation-related storage.
Tip:
Although aP Pro does not calculate Logistics Carbon, you can manually enter a value for it. For more information, see Edit the Logistics Carbon for a part.
Note:
In this example, the percentage difference is not displayed for the Logistics Carbon. If the baseline scenario had a value greater than 0 (zero), the percentage difference would be shown.
-
For this example, all process groups are supported for Sustainability. The 2023-example-EasternEurope scenario has the lower Fully Burdened Cost (USD) and the lower Total Carbon (kg CO2e).