Economic Updates
Exchange Rates
This chart shows the changes and percent changes in currency exchange rates relative to the 2022-10 Regional Data Libraries release.
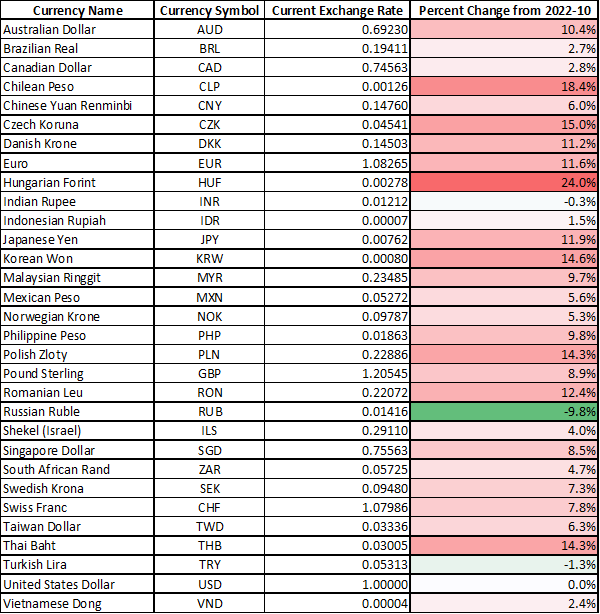
Since the Regional Data Libraries 2022-10 release, the United States dollar (USD) has seen a significant decrease in value. In September 2022, the USD index peaked at 114.10 and has since declined to 103.26. The US Federal Reserve (the Fed) increased interest rates in an attempt to reduce annual inflation to 2%. Although the 2% goal was not reached, annual inflation did fall to 6.4% from its high of 9.1% in June of 2022.
Over the next year, the Fed will try determine how much to increase interest rates while also trying to keep the economy out of a recession. Economists disagree the possibility of a recession over the next 12 months, and the fear of a recession has stoked a reduction in US investment from foreign countries that has, in turn, reduced the valuation of the USD.
On average, currencies tracked in our release notes have gained 7.7% on the USD. The largest gain was 24.0% by the Hungarian Forint. Hungary’s central bank took advantage of non-traditional monetary policy tools to that led to a raise in currency value and a reduction in inflation. Notably, a 1-day deposit facility interest rate increased to 18%. This rate increase took effect in October 2022 and will remain effect until the currency stabilizes. Although drastic base-rate interest rate increases have been made to stop the acceleration of inflation, prices continue to raise. Since January 2022, interest rates have increased by 10.4% to 13%, but inflation has increased from 7.90% to 25.7%. Over the next year, the US central bank has indicated that it will restrain from large increases in interest rates by pledging to take a “patient approach” to its monetary policy.
Labor Rates
This chart shows Labor Rate changes relative to the 2022-10 Regional Data Libraries release.
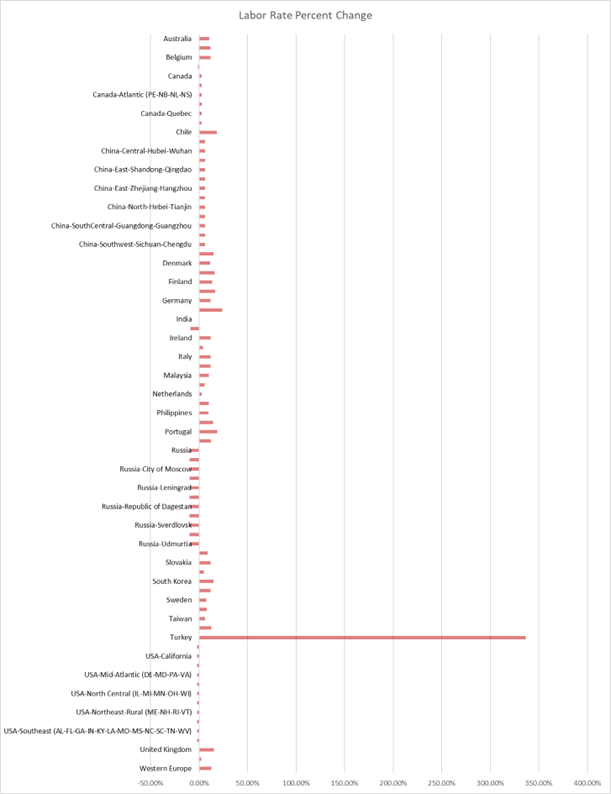
Most labor rates around the world have increased due to fall of the US dollar. The shift to the west as US is no longer the economic safe haven it was viewed as months ago.
In an effort to combat inflation and improve the standard of living across the country, wages in Turkey increased in 2023. The year-over-year minimum wage has increased by 100% in January 2023. Annual inflation peaked in Turkey in October 2022 at 85.51%. Much of this inflation was caused by the crash of the Turkish Lira.
As mentioned in previous release notes, in an effort to rein in inflation and to try to create an account surplus through increasing production, exports, the Turkish government slashed interest rates. The reduction in interest rates actually further devalued the Lira.
Although the Lira has not recovered, over the last three months inflation has decreased to 57.68%. The wage increase could also lead to job losses if industries competing with low wage countries, such as India and Vietnam, lose customers to those markets.
Total Manufacturing Rates
This chart shows changes in Total Manufacturing Rates (Labor + Direct and Indirect Overhead) relative to the 2022-10 Regional Data Libraries release.
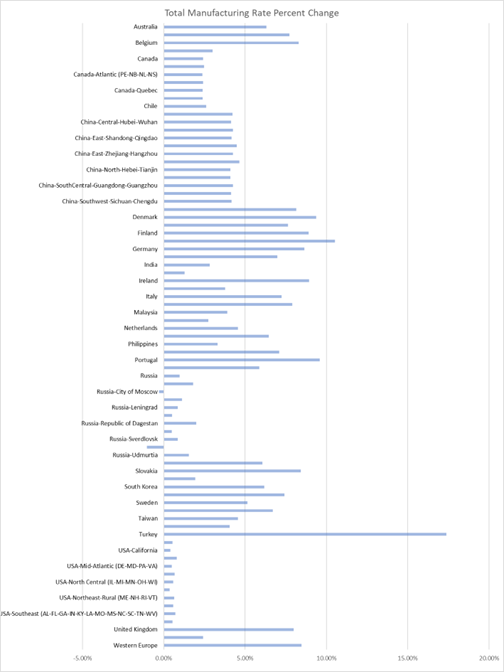
Total manufacturing rates continue to increase in the 2023. Although electricity prices in Europe may have decreased for wholesalers due to the mild winter, and price decreases typically lower the total manufacturing rates, the prices have not decreased for businesses and consumers.
Inflation has decreased across the globe. Global inflation is expected to decrease from 8.8% in 2022 to 6.6% in 2023. This decrease could help to lower future total manufacturing rates.
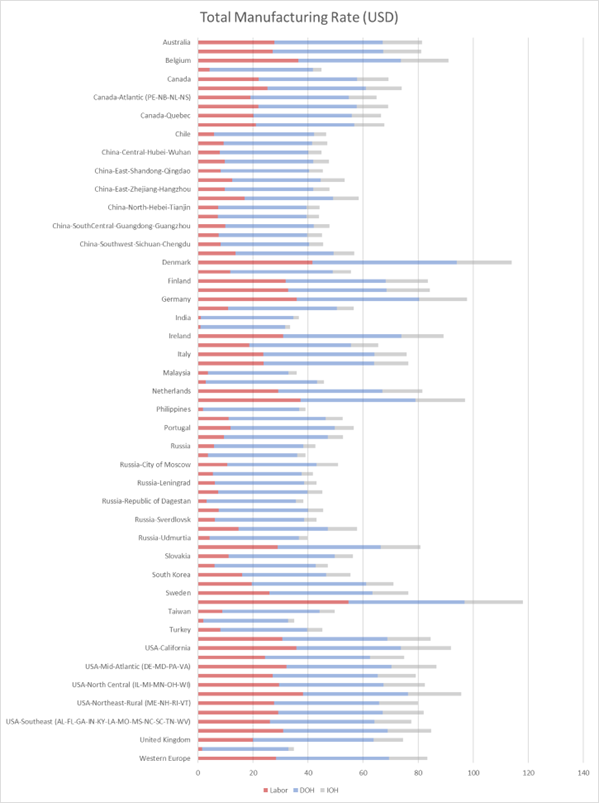
This chart represents the average total manufacturing rate for each region in the Regional Data Libraries 2022-10 release.
Material Rates
This table shows the percent change in material rates relative to the 2022-10 Regional Data Libraries.
| Non-Ferrous | Non-Ferrous | Ferrous Metals | Ferrous Metals | Plastics | Plastics |
|---|---|---|---|---|---|
| Aluminum | 10.0% | Ductile Iron | 9.4% | ABS | -8.1% |
| Aluminum Bronze | 12.9% | Galvanized Steel | -19.9% | ABS -Extrusion Sheet GP | -1.5% |
| Brass | 9.7% | Low-Alloy Steel | -16.7% | Acrylic | -0.5% |
| Bronze | 10.5% | Malleable Cast Iron | 9.2% | HDPE - Extrusion Sheet | 53.7% |
| Copper | 7.7% | Stainless Steel | 5.1% | Nylon | -7.6% |
| Gray Iron | 9.5% | Steel | -10.2% | PP - Extrusion Sheet | 8.7% |
| Heat Resistant Super Alloys | 19.6% | Unalloyed Steel | -18.7% | PS - High Impact Extrusion | 0.4% |
| Magnesium | -15.6% | Polycarbonate | -8.1% | ||
| Titanium | -16.3% | Polypropylene | -10.7% | ||
| Zinc | 3.4% | Polystyrene | -1.8% | ||
| Zinc-Aluminum | 4.3% |
The material rate changes in the 2022-10 release of the Regional Data Libraries represent fluctuations in the materials markets. There were no material price assumption changes in this release.
The price of many metals increase sharply at the beginning of 2023. Large price increases in the costs of aluminum, copper, and iron were due to combination of factors, including the reopening of China's economy, the easing of China's zero-covid polices, lower than expected inflation in the US, and a weaker US dollar. China has been a global manufacturing powerhouse for many years and is expected to continue to produce much of the world’s commodities. However, it is difficult to forecast the long-term effect of its recent policy changes on the global economy because it has had limited involvement in trade since its zero-covid policy ended.
Since our previous release Nylon and ABS prices have fallen due to high buyer inventories. It is expected that these prices may continue to fall in the upcoming months, but what may push up demand is the anticipated increase in automotive production, which is a very large consumer of the engineered resins.
Polypropylene prices have decreased sharply due to the excess supply in the market as well as other economic factors such as high interest rates and inflation. Prices may remain low for the months ahead because year-over-year increases in production capacity greatly out pacing demand.