aP Pro Ticker
The aP Pro Ticker opens in a small window, and provides a limited selection of tools, features, and capabilities:
Note:
In Direct Integration mode, aP Pro opens to the Ticker. Otherwise, aP Pro starts in full view.
aP Pro Ticker icons and command buttons
The following table lists the icons and command buttons available in aP Pro Ticker and explains how they are used.
| Icon | Usage |
|---|---|
 |
Display system messages. The color of the message button indicates the system status: - Green: part was costed successfully without errors. - Yellow: a warning has been produced during costing. - Red: an error has occurred during costing. |
 |
Shows the difference between actual and target costs, if the target cost for the component is set. If the current cost is: - Between 90% and 110% of the target cost; the indicator on the Cost Target icon points upwards - Less than 90% of the target cost; the indicator points to the left - More than 110% of the target cost; the indicator points to the right |
 |
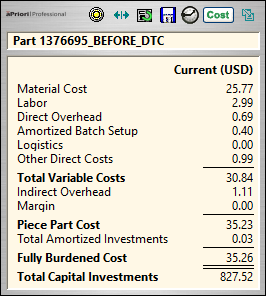
Click this button to expand the aP Pro Ticker, showing the previous cost and the last saved cost. |
 |
In the expanded aP Pro Ticker, click this button to contract the aP Pro Ticker. |
 |
If using Direct Integration mode, access the Geometric Cost Drivers (GCDs) options: -  Refresh the GCDs from the CAD model and calculate new cost using the updated GCDs. Hover the mouse pointer over this icon to see the date and time when the GCDs were last updated. In CAD-Independent mode, this option is available directly from the tool bar. Refresh the GCDs from the CAD model and calculate new cost using the updated GCDs. Hover the mouse pointer over this icon to see the date and time when the GCDs were last updated. In CAD-Independent mode, this option is available directly from the tool bar.-  View the GCDs for the component, opening the aPriori GCDs window is. View the GCDs for the component, opening the aPriori GCDs window is. |
 |
Refresh the GCDs from the CAD model and calculate new cost using the updated GCDs. In CAD-Independent mode, this option is available from the tool bar. In Direct Integration mode, this option is available from the GCDs Options menu. |
 |
Save the cost object and the displayed cost. |
 |
Shows that the displayed cost is current, which means that the component has not changed since this cost was last calculated. Hover the mouse pointer over this icon to see when the displayed cost was last saved. |
 |
Shows that the displayed cost is not current; the component has been changed since this cost was calculated. Place the mouse pointer over this icon to see when the displayed cost was saved. When the cost is not current, the aP Pro Ticker window is dark grey and the Save button is disabled. |
 |
Cost a component. |
 |
Select this button to switch to aP Pro. |