Show a Part's Heat Map (Geometry Analysis)
If you cost your part with the Stock Machining process group, you can display it in the Component Viewer as a heat map.
Click the Geometry Analysis icon ( ) to show your part as a heat map, with a Geometry Analysis bar graph:
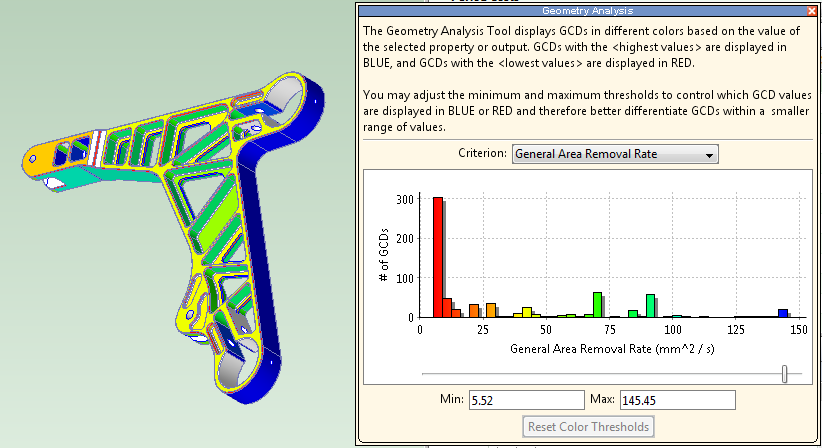
Heat Map Display
Each of the part’s GCDs has a color showing the value range for the GCD of a specified metric.
- If more than one finishing operation is assigned to the GCD, the color indicates the average rate across operations.
- Warmer colors (such as orange and red) indicate higher values; cooler colors (such as green and blue) indicate lower values.
Bar Graph Options
- Criterion: select the heat map metric. For example, if you select General Area Removal Rate, each GCD in the heat map has a color showing the rate of removal for finishing operations assigned to that GCD.
- Min and Max fields: adjust the colors used to display the range of values.
- Click Reset Color Thresholds to restore the default color spectrum for the component.
Tip:
The Design Guidance Tool for Machined Parts presents the same types of machinability issues as the Heat Map, but in a format that is more user-friendly for casual users who are not experts in machining. See Validation and Design Guidance Tabs.