See carbon impact of using renewable energy at a manufacturing facility
This example shows how to identify the impact on the carbon footprint of making a part of using renewable energy to power a manufacturing facility.
If you are making a part at a manufacturing facility for which you have a digital factory in aP Pro, you can investigate the impact of powering that manufacturing facility, fully or partially, using renewable energy. In aP Pro, you can edit the Electricity Carbon Factor of a scenario for a part, and then compare the updated carbon impact of manufacturing the part with the carbon the alternative material with the carbon impact of the currently used material.
See also: See carbon impact of using recycled material
Requirements
To enter and analyze sustainability data, you must have an aPriori Sustainability License and aP Pro 2023 R1 or later.
Limitations
- aP Pro does not yet support Sustainability analysis for all process groups. For a list of currently supported process groups, see Processes supported in Sustainability.
- Carbon from product use, tooling, and end-of-life is not currently considered.
Prerequisites
This example requires:
- A part that has been costed in a version of aP Pro that includes a Sustainability License.
- The Electricity Carbon Factor of the electricity power supply. You can ask the electricity supplier for the Electricity Carbon Factor, or you can calculate the Electricity Carbon Factor (for more information, see Calculate the Electricity Carbon Factor for a Digital Factory). In this example the Electricity Carbon Factor (Energy Carbon Factor in the Part Details tab), changes from 0.47 to 0.41.
Procedure
- Open the scenario for the part.
-
Open the Part Details tab.

-
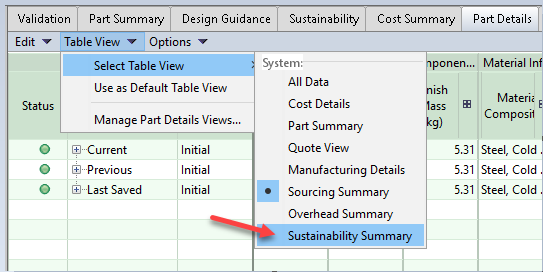
In the Part Details tab, expand the Table View drop-down menu, and then click Select Table View > Sustainability Summary.
-
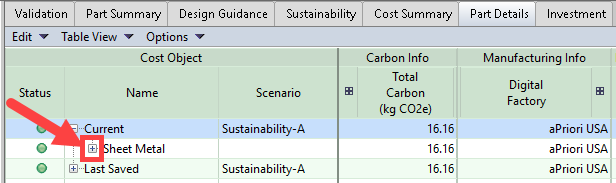
Find the rows for the process group that you are interested in. In this example, you edit the Energy Carbon Factors available for each applicable process, so the process group is Sheet Metal.
-
Expand the node for the process group.
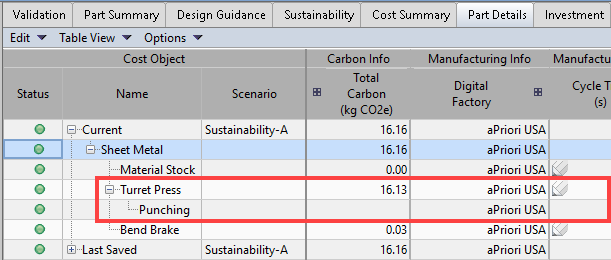
Continue expanding nodes until the process that you are interested in editing appears. In this example, the process of interest is the Turret Press process.
-
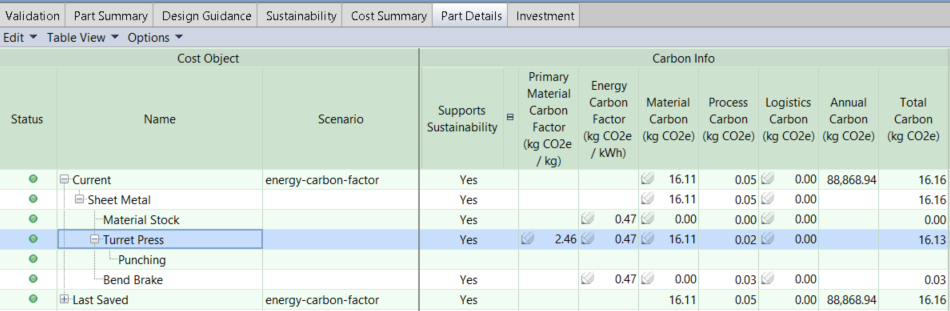
In the Carbon Info column of the table, expand the Total Carbon (kg CO2e) node.
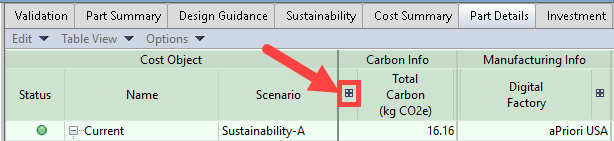
The Carbon Info sub-columns are now visible, including Energy Carbon Factor.
Info:
A pencil icon,
 , indicates that you can edit a value. For more information, see Part Details Overrides.
 -
In this example, you edit the Energy Carbon Factor values for each process that has an Energy Carbon Factor value. In this example, they are the Energy Carbon Factor values of 0.47 for Material Stock, Turret Press, and Bend Brake.
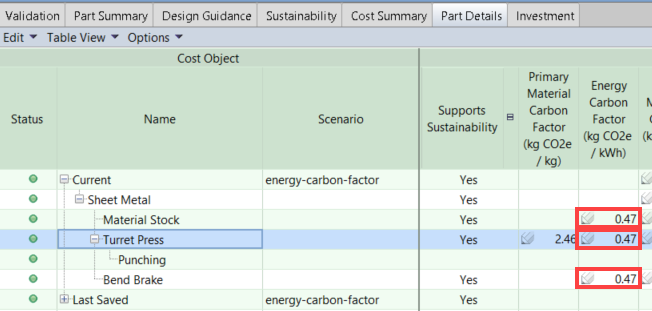
-
For each of the cells, edit the Energy Carbon Factor value. To edit a value, double-click the cell, edit the value, and then press Enter.
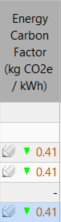
For this example, the values are decreased from 0.47 to 0.41.
You have the option to enter a comment in the Comment dialog for the cell.
The cell displays an arrow and the new value.
The arrow indicates whether the value increased or decreased relative to the prior value.
Tip:
If you prefer not to see the arrows, see Clear Cost Arrows in Part Details tab.
-
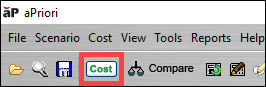
To recost the part, in the aP Pro menu bar, click Cost.
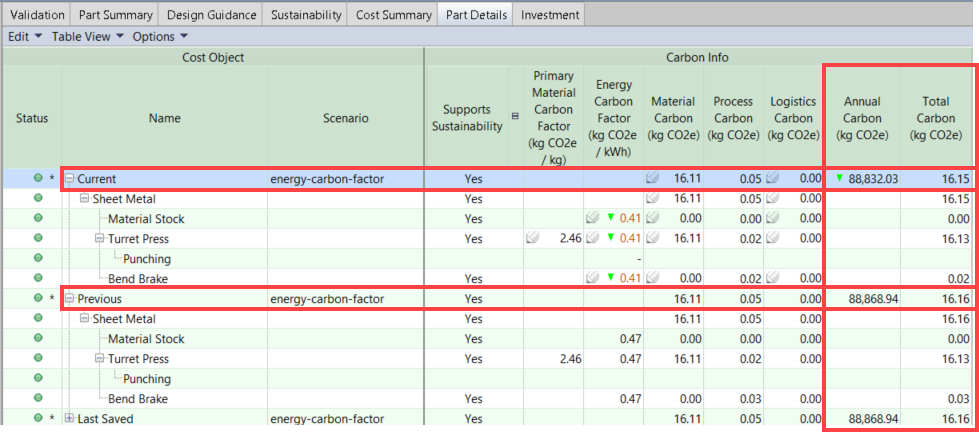
After the scenario has been recosted, the values for Annual Carbon (kg CO2e) and Total Carbon (kg CO2e), update to reflect the effect of the updated value for Energy Carbon Factor.
-
Examine the impact of the change.
In this example, the Current values for Annual Carbon and Total Carbon have decreased. The values in the Current row are lower than the values in the Previous row.
This indicates that the use of the alternative material results in lower Total Carbon.
-
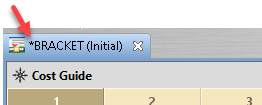
To indicate that the scenario has been changed, but that the changes have not been saved, an asterisk is displayed in the scenario tab.
-
To save the scenario, in the aP Pro menu bar, click the Save button.
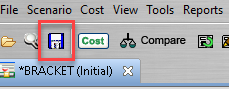
Once the recosted scenario has been saved, the values for the Current, Previous, and Last Saved update.